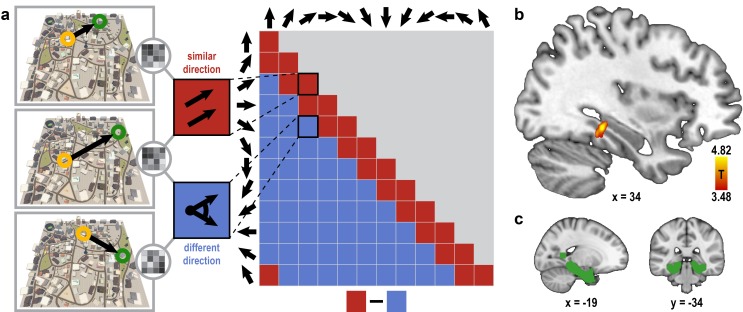
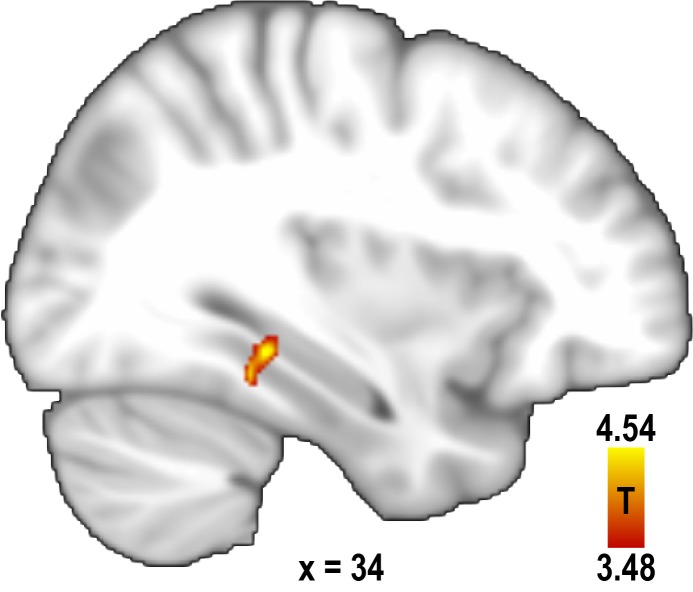
Figure 2. Absolute directional coding in posterior parahippocampal gyrus.
(a) Analysis logic of the one-fold directional analysis for three example trials. High pattern similarity was predicted for pairs of trials sampling similar directions with a maximum angular difference of 30° (red) compared to trials sampling directions 60° or more apart (blue). Note that for illustration purposes the predicted similarity matrix is shown for comparisons across conditions, not single trials. (b) Searchlight results show a significant cluster of voxels in the posterior parahippocampal gyrus (peak voxel MNI coordinates: 34 -34 -10; T23 = 4.82, p = 0.024 corrected for multiple comparisons using small-volume correction) with higher pattern similarity for trials sampling similar directions compared to trials sampling dissimilar directions. Results are shown on the structural MNI template. For display purposes, the statistical map is thresholded at p<0.001 uncorrected. (c) Sagittal and coronal view of the mask used to correct for multiple comparisons (see Materials and methods) displayed on the MNI template brain.
DOI: http://dx.doi.org/10.7554/eLife.17089.008


