. 2016 Aug 30;5:e17089. doi: 10.7554/eLife.17089

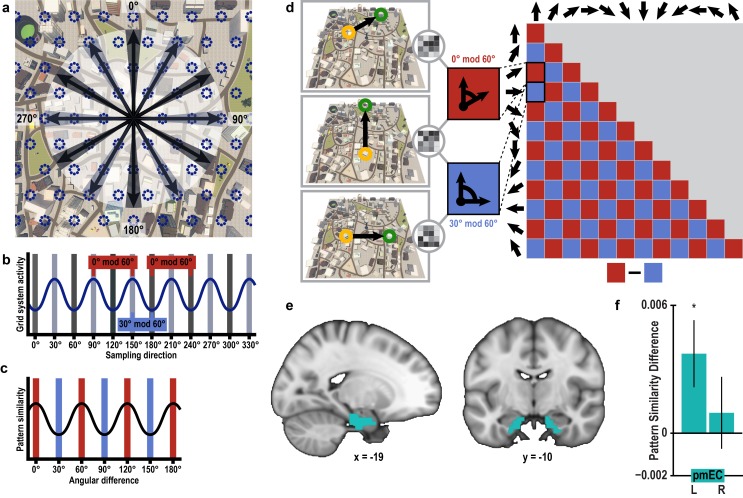
Figure 3. Grid-like representations during imagination.

(a) Six-fold symmetric firing fields of a hypothetical grid cell (dark blue dotted circles) superimposed on an aerial view of Donderstown. Black arrows indicate the twelve sampled directions; light and dark shading highlights directions (multiples of) 60° apart. For illustration purposes, the grid orientation is aligned to the sampled directions; see Figure 3—figure supplement 1 for a different example. (b) The firing rate of the hypothetical response of the grid-cell system as a function of direction, showing a 60° modulation. Shading displays sampling of directions and red and blue markers indicate the two conditions. Note that the oscillatory firing pattern is sampled at the same phase in the 0° modulo 60° condition, but at different phases in the 30° modulo 60° condition. (c) Based on this, we expected a 60° modulation of fMRI pattern similarity values when comparing trial pairs based on the angular difference of their sampled directions. Red and blue shading illustrates the two conditions. (d) Specifically, we predicted higher pattern similarity for trial pairs with a remainder of 0° (0° modulo 60° condition, red) compared to trial pairs with a remainder of 30° (30° modulo 60° condition, blue), when dividing the angular difference of the pair’s sampling directions by 60°. Note that for illustration purposes the predicted similarity matrix is shown for comparisons across conditions, not single trials. (e) ROI mask for posterior medial entorhinal cortex (pmEC) from previous report (Navarro Schröder et al., 2015). (f) Pattern similarity difference (mean and S.E.M.) between the two conditions. The left pmEC exhibited a significant 60° modulation of pattern similarity. No significant differences in pattern similarity were observed in the right pmEC (T23 = 0.57, p = 0.58).

DOI: http://dx.doi.org/10.7554/eLife.17089.012

Figure 3—source data 1. Pattern similarity difference between 0° modulo 60° and 30° modulo 60° condition in left and right posterior medial entorhinal cortex.
DOI: 10.7554/eLife.17089.013

Figure 3.

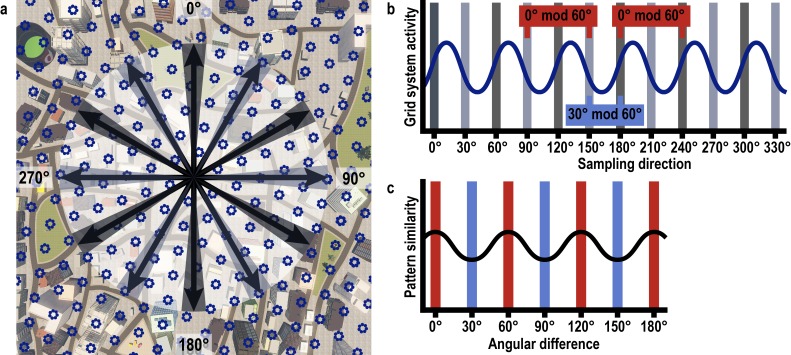
Figure 3—figure supplement 1. Rationale of 60° modulation analysis.

Figure 3—figure supplement 1.

(a) Six-fold symmetric firing fields of a hypothetical grid cell (dark blue dotted circles) superimposed on a top-down view of Donderstown. Black arrows indicate the twelve sampled directions. Light and dark shading indicates directions (multiples of) 60° apart. (b) The firing rate of the hypothetical grid cell as a function of sampling direction exhibits a 60° modulation. Shading shows sampled directions with red and blue markers illustrating the two conditions. Note that the oscillatory firing pattern is sampled at the same phase in the 0° modulo 60° condition, but at different phases in the 30° modulo 60° condition. (c) Based on this, we expected increased pattern similarity when comparing trial pairs from the 0° modulo 60° condition to trial pairs from the 30° modulo 60° condition. The difference between the conditions is smaller than in Figure 3c due to the different sampling of directions with respect to the grid orientation.

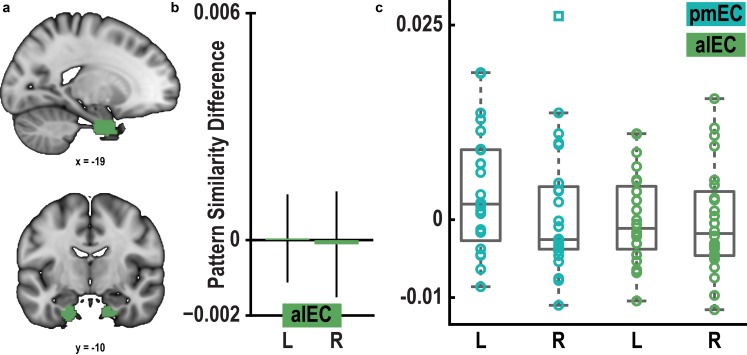
Figure 3—figure supplement 2. Pattern similarity difference between 0° modulo 60° condition and 30° modulo 60° condition in pmEC and alEC.

Figure 3—figure supplement 2.

(a) ROI mask for anterior lateral entorhinal cortex (alEC) based on our previous report (Navarro Schröder et al., 2015). (b) Pattern similarity did not differ between the 0° modulo 60° and the 30° modulo 60° condition in alEC (T23 = 0.04, p = 0.97 and T23 = − 0.08, p = 0.94 for left and right alEC, respectively). (c) Colored markers show pattern similarity difference for each participant in pmEC and alEC. Boxplots indicate 25th and 75th percentile with the middle line representing median pattern similarity difference across participants. Whiskers extend to most extreme data points not considered outliers. Data points defined as outliers (values more than 1.5 times the interquartile range above the 75th percentile or more than 1.5 times the interquartile range below the 25th percentile) are represented by square markers.

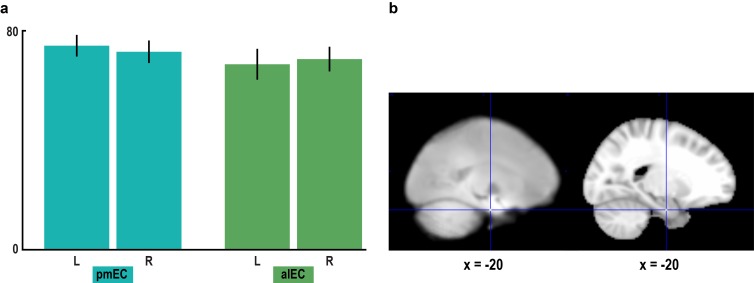
Figure 3—figure supplement 3. Signal quality in the entorhinal cortex.

Figure 3—figure supplement 3.

(a) To assess signal quality in pmEC and alEC, we computed the temporal signal-to-noise ratio (tSNR, see Materials and methods). A repeated-measures ANOVA revealed neither a main effect of region (F1,23 = 0.60, p = 0.448) or hemisphere (F1,23 = 0.00, p = 0.953) nor an interaction between the factors region and hemisphere (F1,23 = 0.97, p = 0.336). Bars represent mean and S.E.M. (b) Left slice shows the mean functional scan averaged across participants. The mean functional images from the four fMRI runs were averaged for each participant before averaging the resulting mean images across participants. Right slice shows the corresponding section of the MNI template. Note that for some participants the edge of the superior parietal lobe was outside the field of view.

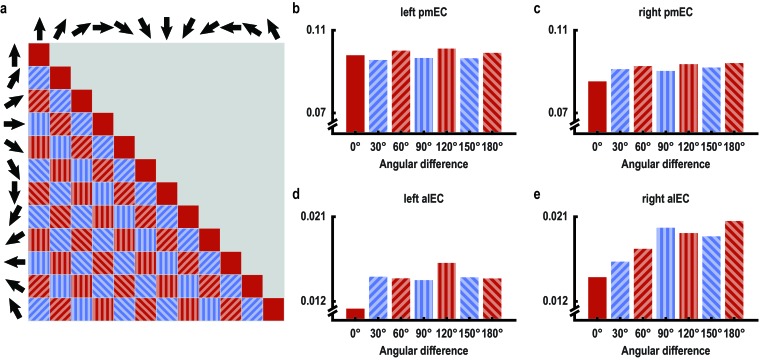
Figure 3—figure supplement 4. 60° periodicity of pattern similarity is consistent across angular differences only in left posterior medial entorhinal cortex.

Figure 3—figure supplement 4.

(a) Pattern similarity was analyzed based on the angular differences of the directions sampled in a trial pair. High pattern similarity was predicted for pairs in the 0° modulo 60° condition (red) in contrast to pairs in the 30° modulo 60° condition (blue). Filled pattern and color indicates angular differences and corresponds to bars in (be), which visualize average pattern similarity for all possible angular differences for exploratory purposes in the entorhinal ROIs. Note the consistent 60° periodicity of the pattern similarity profile across angular differences in left pmEC. A statistical test was performed on the within-subject difference between the two conditions and was significant in left pmEC only (T23 = 2.37, p = 0.027, for all other ROIs, p>0.5). Error bars for each angular difference would not reflect the statistical test performed and are therefore omitted.

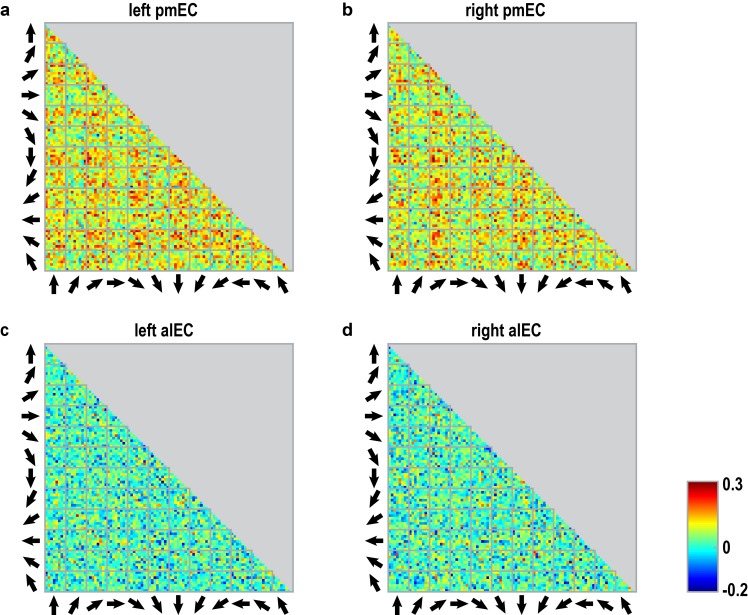
Figure 3—figure supplement 5. Pattern similarity structure across pair-wise comparisons of trials for entorhinal ROIs.

Figure 3—figure supplement 5.

(ad) Matrices show the pair-wise correlations between voxel patterns in the subregions of the entorhinal cortex (a: left pmEC; b: right pmEC; c: left alEC; d: right alEC) across all possible trial comparisons averaged across participants. Arrows signal sampled directions in a given pair of trials. Colorbar indicates size of the correlations in panels (ad).

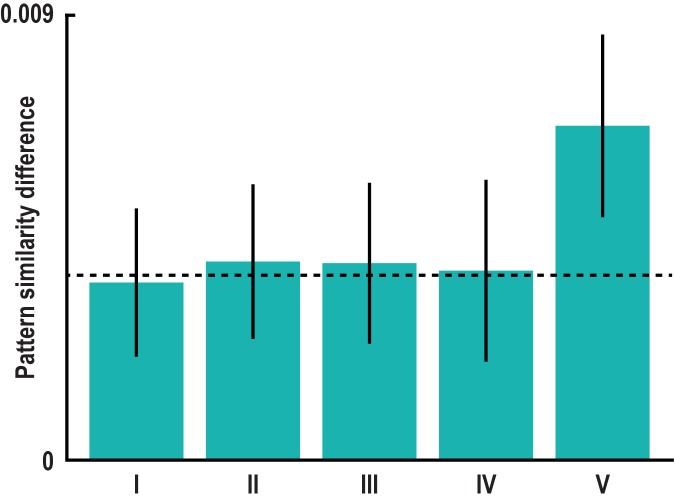
Figure 3—figure supplement 6. 60° modulation of pattern similarity during imagination is not driven by specifics of task design.

Figure 3—figure supplement 6.

(a) Pattern similarity difference between the 0° modulo 60° and the 30° modulo 60° condition remained significant in left pmEC after controlling for specifics of the design. Bars show the mean pattern similarity difference after excluding trial pairs with (I) the same start location (T23 = 2.39, p = 0.025), (II) the same target location (T23 = 2.57, p = 0.017), (III) the same combination of start and target location (T23 = 2.45, p = 0.022), (IV) pairs from the same run (T23 = 2.08, p = 0.049) and (V) pairs with target locations in the inner ring of buildings (T23 = 5.29, p<0.001; see Materials and methods). This excludes potential influences of imagining the same start or same target location, the same combination of start and target location and temporal auto-correlations on the effect. Error bars indicate S.E.M., dashed line shows mean pattern similarity difference in left pmEC from main analysis (Figure 3b).

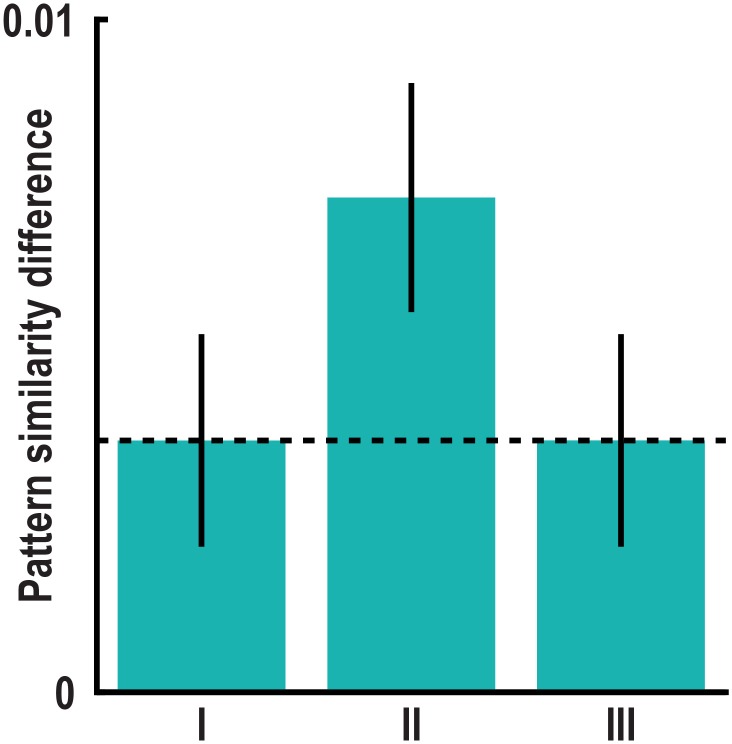
Figure 3—figure supplement 7. 60° modulation of pattern similarity during imagination after controlling for distance measures.

Figure 3—figure supplement 7.

We controlled for the distances between start and target locations in a trial pair using three distance measures, which differed between the 0° modulo 60° and the 30° modulo 60° condition (see Materials and methods). The distance measures are illustrated in Figure 2—figure supplement 2b. In separate GLMs we used the distance measures as predictors of pairwise pattern similarity and computed the mean pattern similarity difference between the 0° modulo 60° and the 30° modulo 60° condition on the residuals of these GLMs. With this approach we controlled for pattern similarity due to (I) the average distance from start to target location in a trial pair, (II) the difference in distance from start to target location in a trial pair and (III) the average distance between all four buildings in a trial pair (see Materials and methods). All T23 > 2.36, all p<0.03, error bars indicate S.E.M., dashed line shows mean pattern similarity difference in left pmEC from main analysis (Figure 3b). The effect also remained significant when using binary (high vs. low) distance predictors (all T23 > 2.44, all p<0.03).

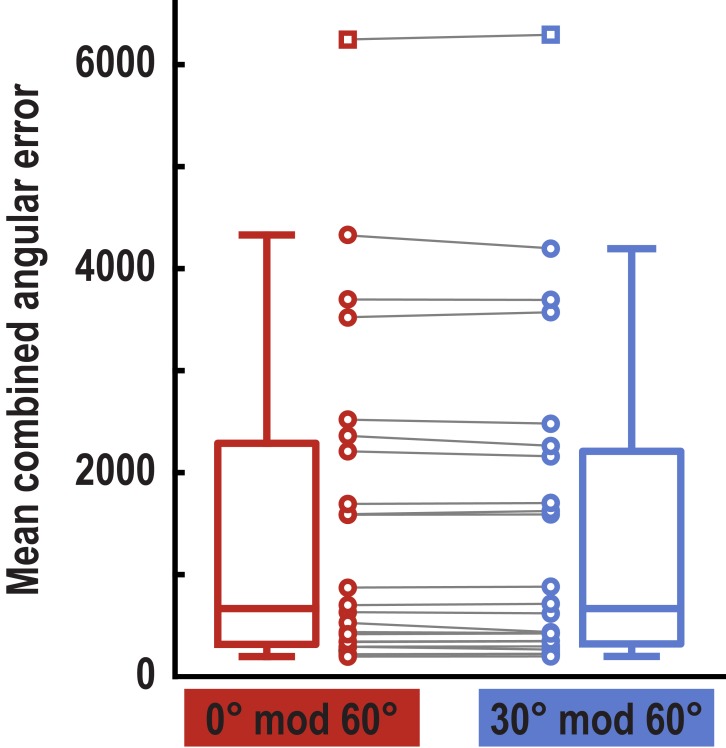
Figure 3—figure supplement 8. Behavioral performance for trial pairs in the 0° modulo 60° and the 30° modulo 60° condition.

Figure 3—figure supplement 8.

Error values were multiplied for the two trials of each pair and averaged for the two conditions. Boxplots indicate 25th and 75th percentile with the middle line representing median combined error across participants. Whiskers extend to most extreme data points not considered outliers. Data points connected by lines show combined errors for all subjects in the two conditions (no difference between conditions, T23 = 1.24, p = 0.227). Data points defined as outliers (values more than 1.5 times the interquartile range above the 75th percentile or more than 1.5 times the interquartile range below the 25th percentile) are represented by square markers. Note that the participant shown here as an outlier performed above chance and that there were no outliers in our main pattern similarity analysis (see Figure 3—figure supplement 2).

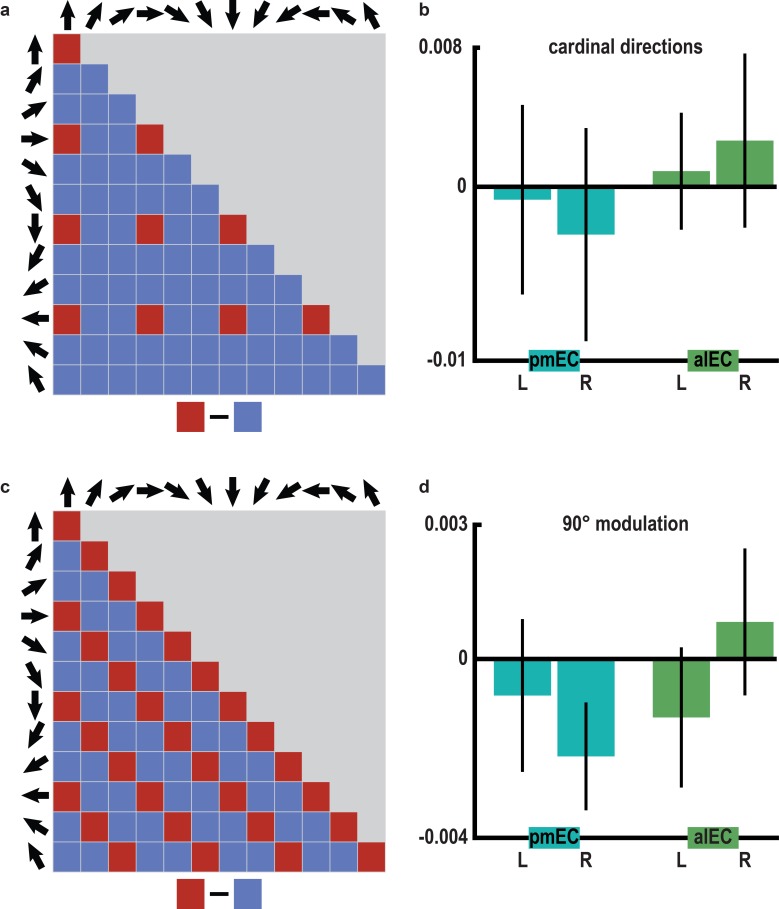
Figure 3—figure supplement 9. No evidence for representations of cardinal directions or 90° modulation of pattern similarity in the entorhinal cortex.

Figure 3—figure supplement 9.

(a) Structure of pattern similarity values used to test for coding of cardinal directions in the entorhinal cortex. If entorhinal cortex activity would be sensitive to cardinal directions, high pattern similarity would be expected for pairs of trials sampling cardinal directions in comparison with trials sampling other directions. Note that for illustration purposes the tested similarity matrix is shown for comparisons across conditions, not single trials. (b) Pattern similarity did not differ between pairs of trials sampling cardinal directions and pairs of trials sampling other directions in pmEC (differences scores: left: T23 = -0.136, p = 0.893; right: T23 = −0.449, p = 0.658) or alEC (differences scores: left: T23 = 0.266, p = 0.793; right: T23 = 0.530, p = 0.601). (c) To corroborate the specificity of the 60° modulation of pattern similarity in pmEC, we examined a possible, yet biologically implausible four-fold symmetry in entorhinal pattern similarity values. We tested for increased pattern similarity for pairs of trials sampling directions 90° or multiples thereof apart (0° modulo 90° against 30° or 60° modulo 90°), using the same analysis logic as for the main analysis (0° modulo 60° against 30° modulo 60°) but now with a 90° periodicity. (d) Pattern similarity values did not differ between these conditions in pmEC (differences scores: left: T23 = −0.48, p = 0.637; right: T23 = −1.81, p = 0.084) or alEC (differences scores: left: T23 = −0.83, p = 0.413; right: T23 = 0.50, p = 0.618). Bars in (b and d) represent mean and S.E.M.

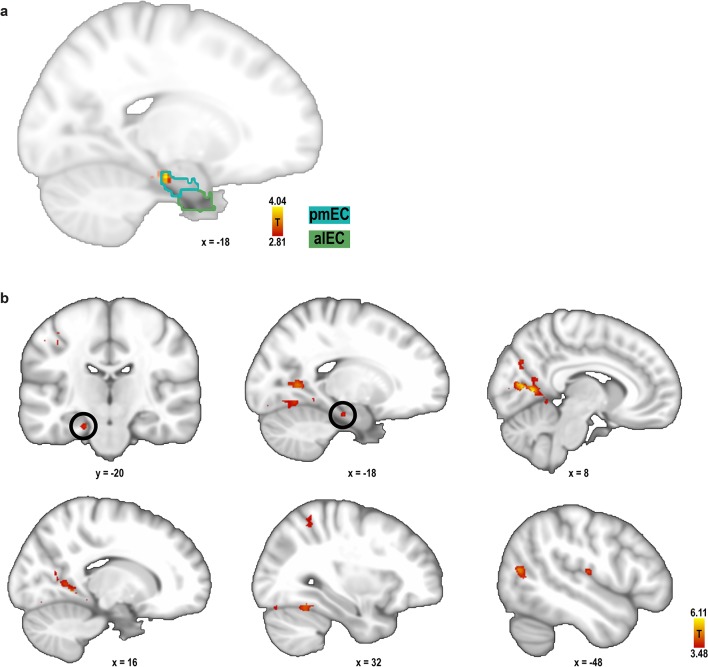
Figure 3—figure supplement 10. Searchlight analysis for 60° modulation of pattern similarity during imagination.

Figure 3—figure supplement 10.

For each search sphere, the difference in pattern similarity for trial pairs in the 0° modulo 60° condition and the 30° modulo 60° condition was calculated. (a) One entorhinal cluster exhibited increased pattern similarity for the 0° modulo 60° condition (peak MNI coordinates: −18 − 20 −22; T23 = 4.04, p = 0.046, FWE-corrected for multiple comparisons in bilateral pmEC and alEC using small volume correction) and is shown together with the masks of pmEC and alEC, outlined in dark and light green, respectively. This result confirms our finding from the ROI analysis. Statistical map is thresholded at p < 0.005 uncorrected and masked to show entorhinal cortex only. (b) Further exploratory whole-brain searchlight analysis showed greater pattern similarity for the 0° modulo 60° condition in the lingual gyrus (MNI coordinates: 8 −62 6, T23 = 6.11), precuneus (−20 −60 4, T23 = 5.35), cuneal cortex (10 −74 26, T23 = 5.26), lateral occipital cortex (−42 −66 6, T23 = 5.06), occipital pole (−32 −90 10, T23 = 4.93), supplementary motor cortex (0 −14 56, T23 = 4.54), central opercular cortex (−50 −16 12, T23 = 4.46), occipital fusiform gyrus (38 −74 −18, T23 = 4.36), angular gyrus (54 −56 26, T23 = 4.34), superior parietal lobule (30 −52 58, T23 = 4.12) and supramarginal gyrus (−64 −50 22, T23 = 4.09). Slices show the statistical image at 1 mm resolution at a significance threshold of p<0.001. Labels were obtained from the Harvard-Oxford Structural Cortical Structural Atlas available in FSL. For each region peak voxel MNI coordinates and statistics are reported.