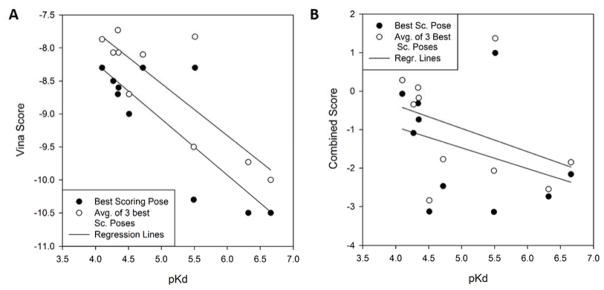
Figure 7.
The correlation between the scores and experimentally determined pKd in 2013 Phase 3. Filled circles, for each ligand, its lowest energy (score) among the constructed conformations was plotted. Empty circles, the average of the three lowest energies (scores) among the constructed conformations was plotted for each ligand. Lines are linear regression between pKd and the scores. A: Correlation with the Vina score of the ligands. B: Correlation with the combined score of Vina and Patch-Surfer.

