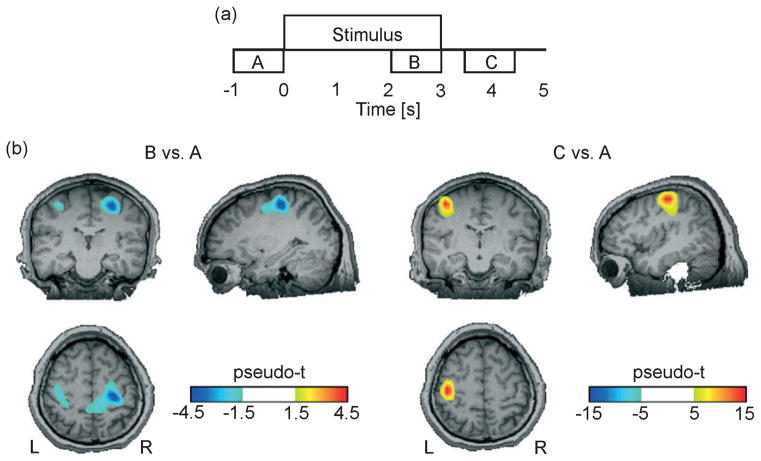
Fig. 2.
Induced responses during attended vibrotactile stimulation. (a) The diagram shows the time intervals (A / B / C) used for synthetic aperture magnetometry beamformer analysis. (b) Volumetric maps of beta ERS / ERD during stimulation (B vs. A) and following stimulus offset (C vs. A) in a single subject are overlaid on the subject’s structural MRI. Induced responses occur in the ipsilateral SI (ERD) and contralateral MI (ERS). L, left; R, right.

