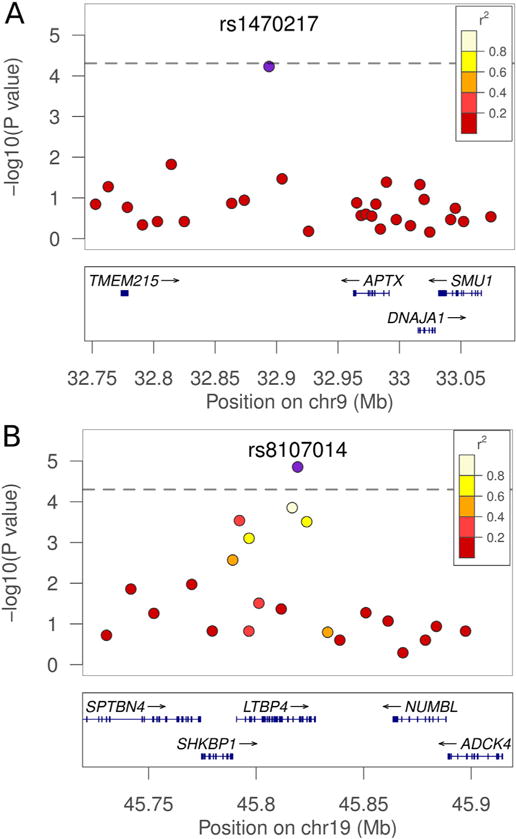
Fig. 2.

Regions of highest association with VL in linkage follow-up regions. Associations between the SNPs on chromosomes 9 (A) and 19 (B) are shown in detail. On chromosome 9, rs1470217 is indicated as the blue plot point. The distribution of SNPs covering 350 kb is shown above. On chromosome 19, rs8107014 is shown with 200 kb around the region. The blue points represent the strongest association for the VL trait within the region of interest. The LD structure between the SNP with the best p-value and surrounding SNPs is indicated by a color gradient on flanking SNPs, with white being in strong LD and red being in weak LD. The dashed line represents an adjusted Bonferroni threshold of significance at a p = 5.2e−05 cutoff (i.e. p = 0.05/961 LD blocks). (For interpretation of the references to color in this figure legend, the reader is referred to the web version of this article.)
