
FIGURE 2.
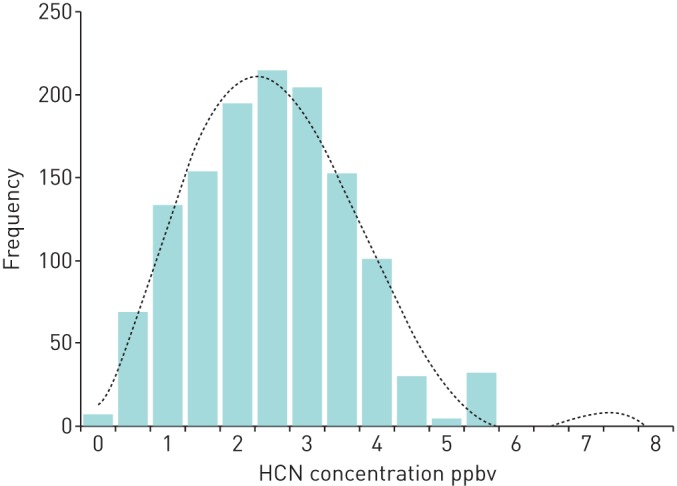
Histogram showing the breath hydrogen cyanide concentrations in samples taken from children who remained free from Pseudomonas aeruginosa throughout the study. The dashed line represents the polynomial trend.
Official websites use .gov
A
.gov website belongs to an official
government organization in the United States.
Secure .gov websites use HTTPS
A lock (
) or https:// means you've safely
connected to the .gov website. Share sensitive
information only on official, secure websites.
Histogram showing the breath hydrogen cyanide concentrations in samples taken from children who remained free from Pseudomonas aeruginosa throughout the study. The dashed line represents the polynomial trend.