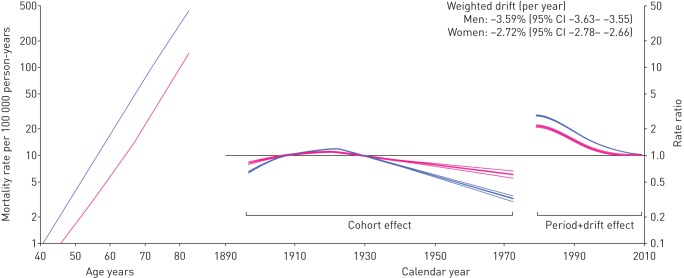
FIGURE 4.
Age, cohort and time period effects and weighted drift of mortality rates for chronic lower respiratory diseases for men (blue lines) and women (pink lines) in Italy, 1978–2010. Age effects are presented as mortality rates for the reference time period (2010); time period effects are presented as rate ratios relative to 2010; and cohort effects are constrained to be 1, on average, with 0 slope. All effects are modelled using cubic splines.

