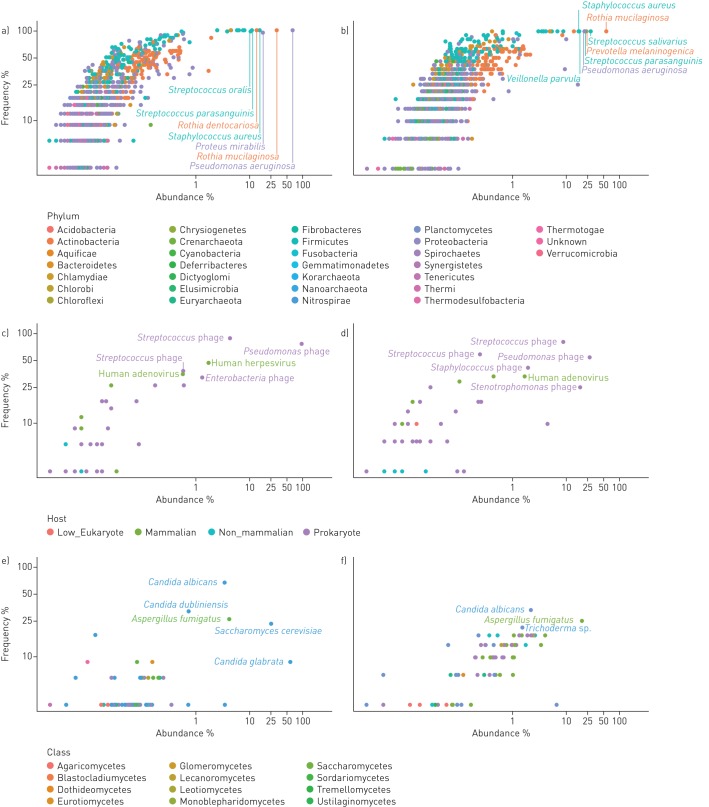
FIGURE 2.
Frequency and abundance of microbial species in the cystic fibrosis (CF) lower airways metagenome. Each dot in the double logarithmic graphs depicts the identification frequency of a species and its mean relative abundance in sputa collected from a, c, e) exocrine pancreas insufficient and b, d, f) exocrine pancreas sufficient CF patients. Abundance was separately normalised for a, b) bacteria, c, d) DNA viruses and e, f) moulds and fungi. The name of a taxon is depicted for the most common and most abundant species. Bacterial taxa belonging to the same phylum are indexed by matching colour. Viruses are differentiated by their host. Moulds and fungi are differentiated by class. Please note that the data points depict the relative abundance of individual species found in the whole dataset of all exocrine pancreas insufficient and sufficient samples.

