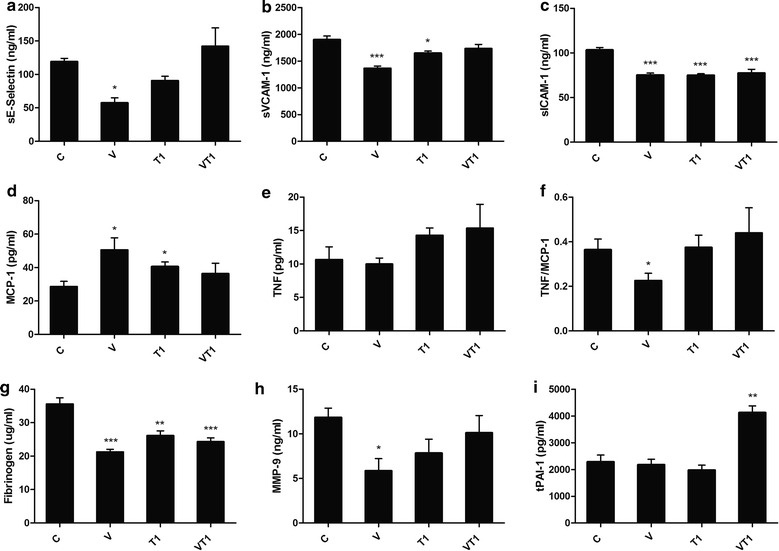
Fig. 3.

Atherosclerosis related biomarkers in plasma. ApoE−/− mice (n = 4–5 per group) were fed high fat diet (C) supplemented with VSL#3 (V), telmisartan (T1) or both (VT1). Serum sE-selectin (a), sVCAM-1 (b), sICAM-1 (c), MCP-1 (d), TNF (e), TNF/MCP-1 (f), fibrinogen (g), MMP-9 (h) and tPAI-1 (i). Data was presented as mean ± SD. Asterisk indicates significant differences from the control group (c). *p < 0.05; **p < 0.01; ***p < 0.001
