
Fig. 5.
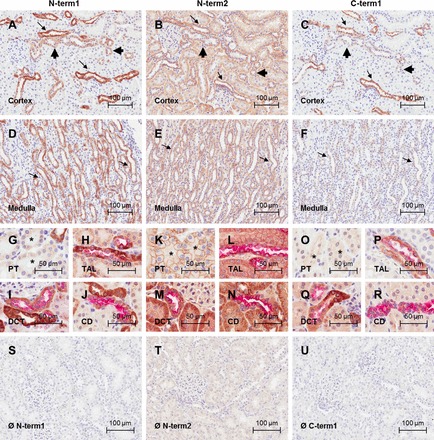
CaSR immunolocalization in rat kidney sections. Photomicrographs of rat cortical kidney sections immunostained with the CaSR antibodies N-term1 (Thermo; A), N-term2 (Anaspec; B), and C-term1 (W. Chang; C) are shown. Photomicrographs of rat medullary kidney sections immunostained with the CaSR antibodies N-term1 (D), N-term2 (E), and C-term1 (F) are also shown. Positive CaSR signal corresponds to immunoperoxidase staining (brown), and nuclei are counterstained with hematoxylin (blue). Arrows indicate stronger signal consistent with TAL, and arrowheads indicate weaker signal consistent with DCT and CD. Photomicrographs show CaSR immunoreactivity in the PT, identified by the presence of brush border in kidney sections immunostained with N-term1 (G), N-term2 (K), and C-term1 (O). Asterisk indicates the PT. Photomicrographs show CaSR immunoreactivity in the TAL, identified by dual staining with Tamm-Horsfall protein in kidney sections immunostained with N-term1 (H), N-term2 (L), and C-term1 (P). Photomicrographs show CaSR immunoreactivity in the DCT, identified by dual staining with the thiazide-sensitive Na-Cl cotransporter (NCC) in kidney sections immunostained with N-term1 (I), N-term2 (M), and C-term1 (Q). Photomicrographs show CaSR immunoreactivity in the CD, identified by dual staining with AQP2 in kidney sections immunostained with N-term1 (J), N-term2 (N), and C-term1 (R). Nephron segment marker signal corresponds to (red) fast red staining. Photomicrographs for the negative controls are shown for N-term1 (S), N-term2 (T), and C-term1 (U) performed by incubation with the corresponding isotype controls. Scale bar = 100 μm for pictures in A–F and S–U and 50 μm for pictures in G–R.