Fig. 5.

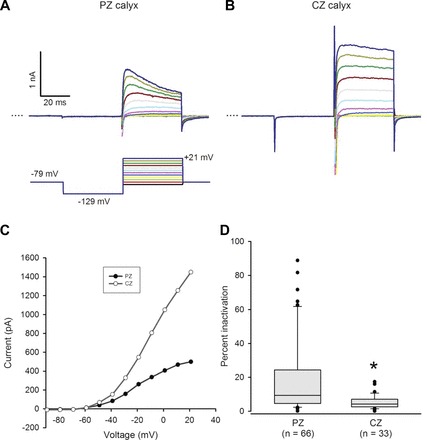
Inactivation of outward K+ currents varies with zone. A and B: representative outward currents in a PZ and a CZ calyx. Calyces were held at −79 mV, stepped to −129 mV, and then stepped from −89 to +21 mV in incrementing 10-mV steps of 40-ms duration (standard voltage protocol, shown below the PZ current traces). Dotted line indicates zero current (0 pA). Scale for B same as A. C: current amplitude measured at the end of each 40-ms voltage step is shown vs. voltage for the PZ and CZ calyces shown in A and B. Current activated above −60 mV. D: peak current and current at the end of the 40-ms voltage step to +21 mV (dark blue trace in A and B) were measured to calculate % inactivation [(Ipeak − Iend)/Ipeak × 100]. Box plots show % inactivation for PZ and CZ calyces. Median inactivation (line in box) was 9.4% in PZ calyx terminals (n = 66), significantly greater than the value of 4.2% in CZ calyx terminals (n = 33; P < 0.001, Mann-Whitney rank sum test).
