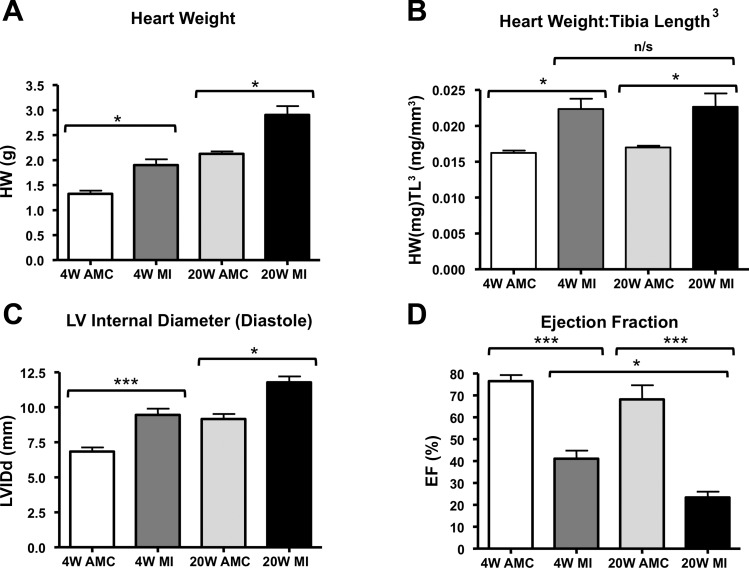
Fig. 1.
Biometric and echocardiographic measures of cardiac hypertrophy. A: heart weight measurements in grams. B: heart weight per tibia length3 (HW:Tibia Length3) measuring the degree of hypertrophy at both time points. C: measurement of left ventricular (LV) internal diameter indicating LV dilatation at both MI4W and MI20W. D: ejection fraction (EF) shows decline in MI4W and MI20W. (n = 4–6 rats in each group, *P < 0.05, ***P < 0.001 by one-way ANOVA with Tukey's correction).

