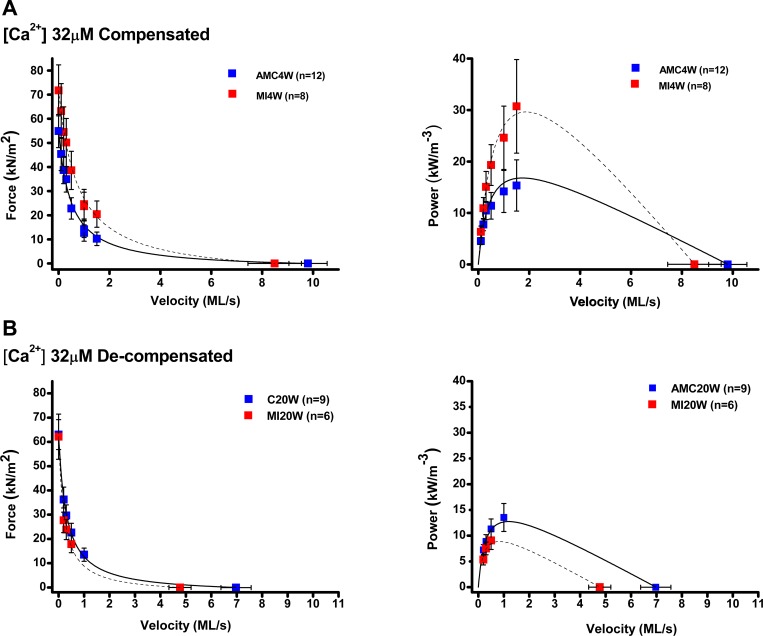
Fig. 2.
Force-velocity (FV) and power velocity (PV) relations from myocardial infarction (MI)4W, MI20W, age-matched control (AMC)4W and AMC20W trabeculae at 32 μM [Ca2+]. A: FV and PV relationships from MI4W, red squares, n = 8, and AMC4W, blue squares, n = 12, at saturating [Ca2+] (32 μM). Solid and dotted lines represent the Hill equation fits of trabeculae from control and infarcted animals respectively. B: FV and PV relationships from MI20W, red squares, n = 6, and AMC20W, blue squares, n = 9, at physiological [Ca2+] (32 μM).

