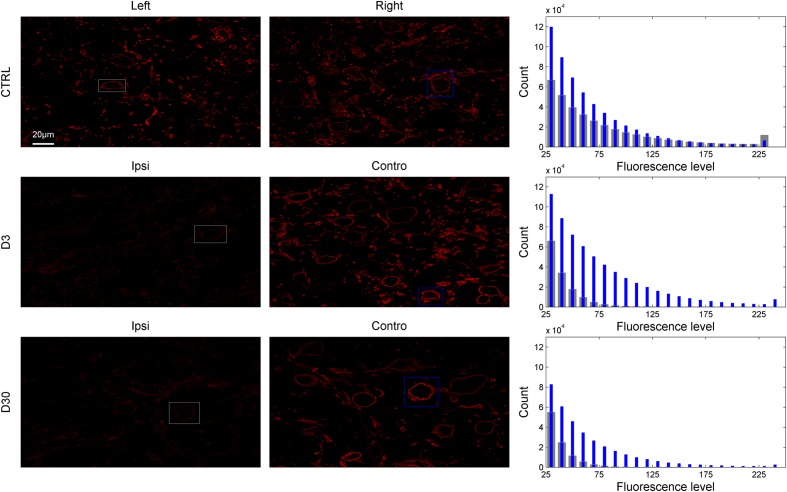
FIGURE 6.
Examples of entire slices showing KCC2-related fluorescence in control and lesioned animals (D3 and D30 post-lesion) in the left and right VCN (or VCN ipsilateral and contralateral side to the lesion; first and second column). The corresponding distribution of fluorescence from the slices is shown in the third column (gray bars: left or ipsilateral to the lesion, blue bars: right or contralateral to the lesion). The region of interests delineated by gray and blue rectangles in the first and second columns are showed in Figure 7 at higher magnification.

