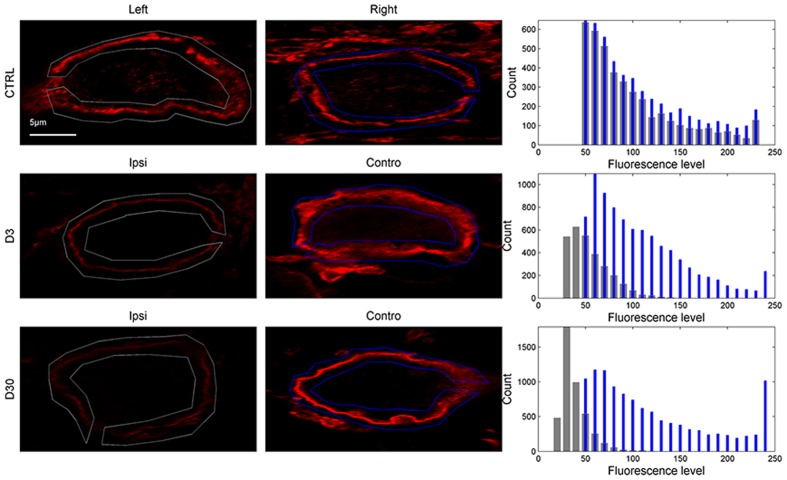
FIGURE 7.
KCC2-related fluorescence of cells bodies in control and lesioned animals from the region of interests delineated in Figure 6 (first and second column). The distribution of fluorescence levels from the region of interest drawn around the plasma membrane is shown in the third column (gray bars: left or ipsilateral to the lesion, blue bars: right or contralateral to the lesion).

