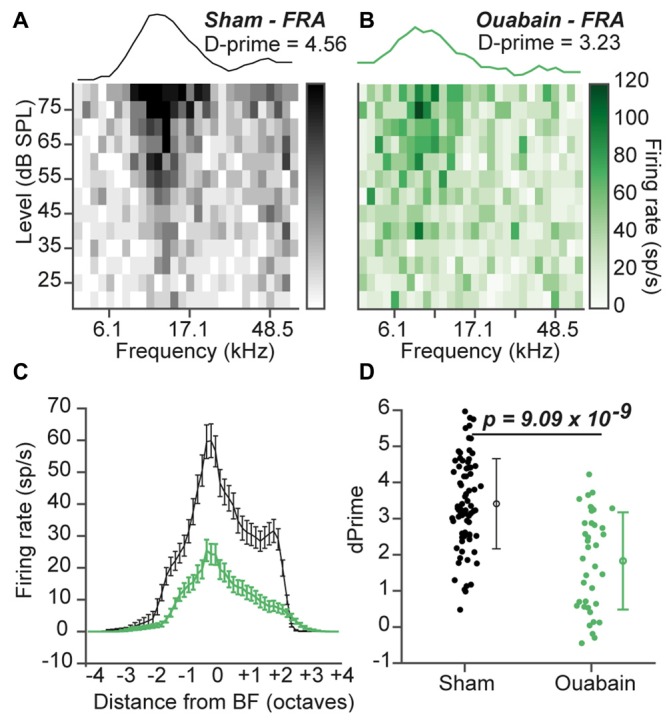
Figure 4.

Diminished pure tone receptive fields persist 30 days after ouabain treatment. (A,B) Example frequency response area (FRA) from a single multiunit site from a sham (A) and ouabain-treated (B) mouse. Line plot above each FRA is the average tuning function across three stimulus levels, centered on the site’s best level. The FRA tuning quality is measured with the D-prime statistic (see “Materials and Methods” Section). (C) Mean frequency response functions from significantly responsive sites in sham and ouabain groups. Error bars are mean ± SEM. (D) D-prime values indicate a significant decrease in FRA quality 30 days after ouabain treatment (p = 9.09 × 10⁻⁴, unpaired t-test). Error bars are mean ± standard deviation.
