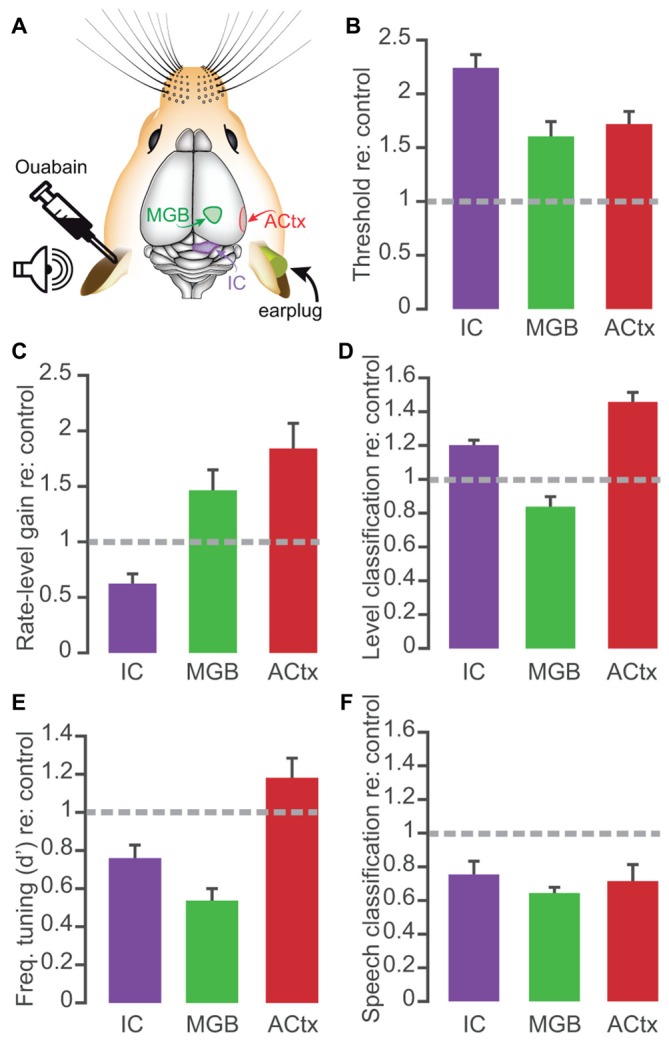
Figure 7.

Comparison of main effects of 30 days of recovery from ouabain treatment in the midbrain, thalamus and cortex. (A) Schematic of color-coded recording locations, contralateral to the ouabain- or sham- treated ear. Auditory cortex (ACtx) and inferior colliculus (IC) recording results taken from Chambers et al. (2016). (B–F) Bar plots represent the mean ± SEM of rate-level threshold (B), gain in spikes/s per 5 dB step (C), probability of accurate level classification with a 10-ms PSTH bin size (D), FRA d-prime value (E), and probability of accurate speech token classification (F). All values represent those taken at 30 days after ouabain treatment, normalized to the mean value from control recordings from the matched brain structure. For classification probability, mean values reflect the mean performance at each sound level or speech token, across the population of recording sites.
