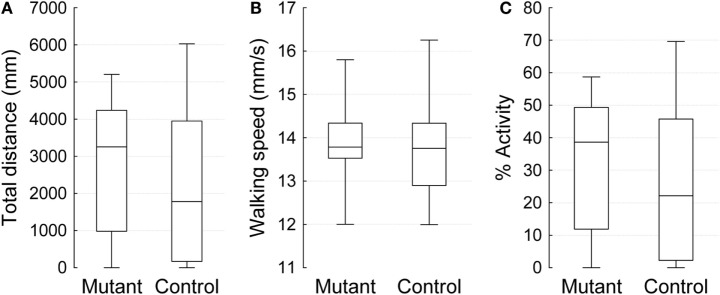
Figure 2.
Open field 10 min video-tracking data for 2-week-old IPLA2-VIA mutant and control males. Plots show the median (horizontal line), 25 and 75% quartiles (box), and extreme (min/max) values (whiskers). (A) The total distance covered in 10 min (mm), (B) Mean of walking speed (mm/s), and (C) Percent activity over time.

