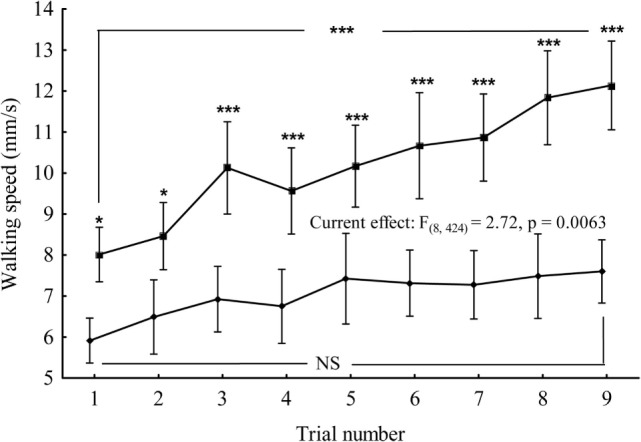
Figure 6.

Mean of the walking speed for control (upper curve) and IPLA2-VIA mutant (lower curve) flies plotted as a function of the number of successive trials. Tukey HSD post hoc comparisons show differences between mutant and control in the mean of walking speed for every trial. Vertical bars denote 0.95 confidence intervals. Current effect represents the interaction effect between genotype and number of trials. Also, shown are the comparisons between first and last trial within the same genotype. *denotes significant differences at p < 0.05, or ***p < 0.001, NS denotes non-significant.
