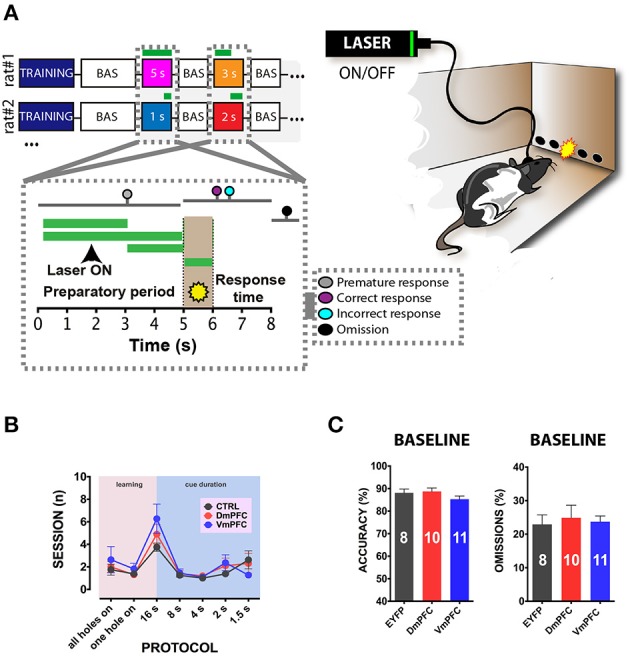
Figure 3.

5-CSRTT: protocols, training and baseline performance. (A) After stable baseline performance (BAS) for three consecutive sessions rats were assigned to the testing phase. Colored squares in the top-right panel represent the different light epochs of stimulation used. Numbers represent the length of the stimulation per session. White squares in between the stimulation days represent a baseline session when no light was delivered in the brain. Bottom-right panel represents a schematic picture of a single trial of the task. The first 5 s reported in the x axis shows the preparatory period of sustained attentional state, the light brown period (5th to 6th s in the x axis) refers to the presentation of the cue, and the last 2 s represent the limited hold period. Colored dots represent the possible responses that were recorded during the session. Responses before cue presentation were considered as premature and punished with a 5 s time-out period. Correct responses were rewarded with a food pellet, whereas incorrect pokes were punished with a time-out period. If a response did not occur within the limited hold period, an omitted trial was recorded. Green lines represent the different light epochs (see methods). Left panel reports a representative illustration of a rat performing in the 5-CSRTT. Rats are bilaterally connected via patch cables to a laser, which delivers (ON) or does not deliver (OFF) light in the desired epoch. The percentage of trials with light ON and OFF was approximately fifty for both options. (B) Illustration of the number of sessions within each training phase and stimulus duration of the task for the three different groups of rats included in the study (CTRL: n = 8; DmPFC: n = 10; VmPFC: n = 11; data are expressed as mean ± S.E.M.). (C) Graphs illustrating the averaged baseline with cables in accuracy and omissions for the 3 groups. Results are expressed as mean ± S.E.M.
