Figure 1.
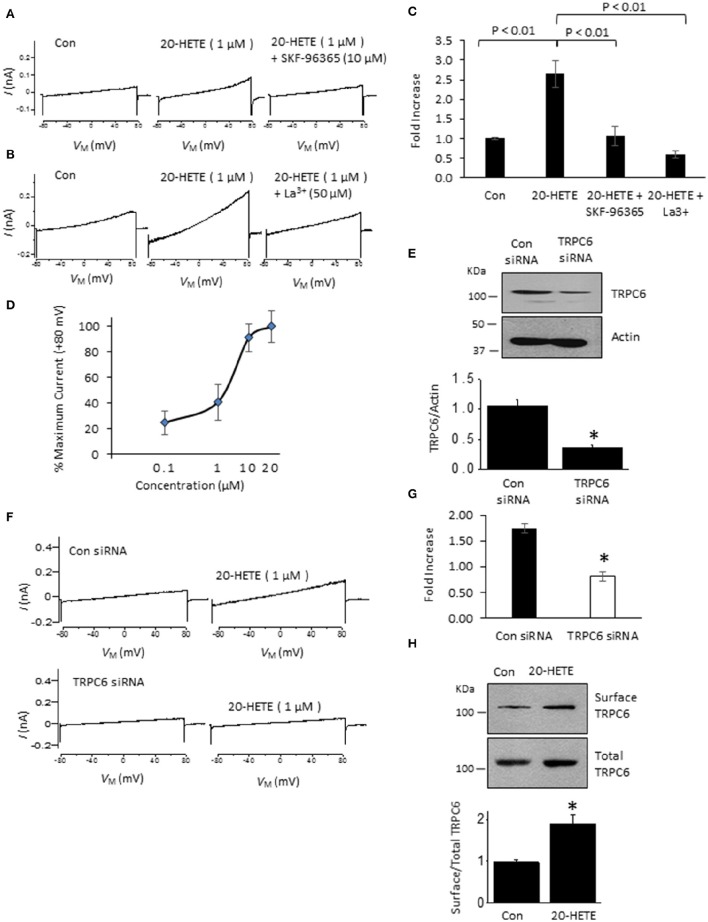
Currents activated by 20-HETE in cultured podocytes. (A) Examples of currents evoked by 2.5-s ramp voltage commands (−80 mV to +80 mV). Trace to the left shows currents shortly after making whole-cell contact. Middle trace is from the same cell 3 min after exposure to 1 μM 20-HETE, and trace to the right shows complete blockade of the current by SKF-96365. (B) Similar recording from a different cell showing complete block of 20-HETE-evoked current by 50 μM La3+. (C) Summary of results of this experiment (n = 10 cells per group). Data are presented as fold-increase over initial baseline current at +80 mV. The differences in means were calculated by Tukey's HSD post hoc test following one-way ANOVA. (D) Percentage of maximal current amplitudes at +80 mV plotted vs. concentration of 20-HETE. Note saturation of the response by 20 μM 20-HETE. (E) Immunoblot analysis showing effects of non-targeting siRNA (con) and siRNA targeting TRPC6 on total abundance of TRPC6. A typical immunoblot is shown above graphical summary of experiments from three different transfections. Asterisk indicates P < 0.01 (unpaired t-test). (F) Examples of responses to 1 μM 20-HETE in cells pre-treated with non-targeting (control) or TRPC6-targeting siRNA using procedures shown in E. Note lack of response to 20-HETE after TRPC6 knockdown. (G) Summary of the results of the experiment in panel F (n = 6 cells per group). Asterisk indicates P < 0.05 (unpaired t-test). (H) Cell-surface biotinylation assays show that exposure to 1 μM 20-HETE for 24 hr increases steady-state surface abundance of TRPC6. Typical blots are shown on top of graphical summary of three repetitions of this experiment. Asterisk indicates P < 0.05 (unpaired t-test).

