Figure 2.

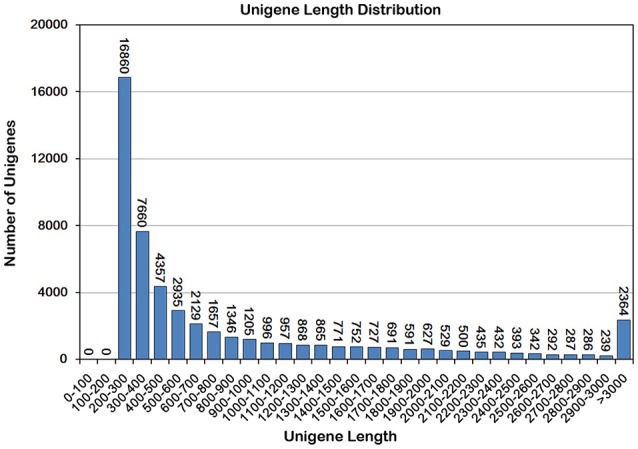
Sequence length distribution of the unigenes in ‘Furongli’ plum fruit transcriptomes. The x-axis indicates unigene length interval from 200 bp to > 3000 bp. The y-axis indicates the number of unigenes of each given sequence length.

Sequence length distribution of the unigenes in ‘Furongli’ plum fruit transcriptomes. The x-axis indicates unigene length interval from 200 bp to > 3000 bp. The y-axis indicates the number of unigenes of each given sequence length.