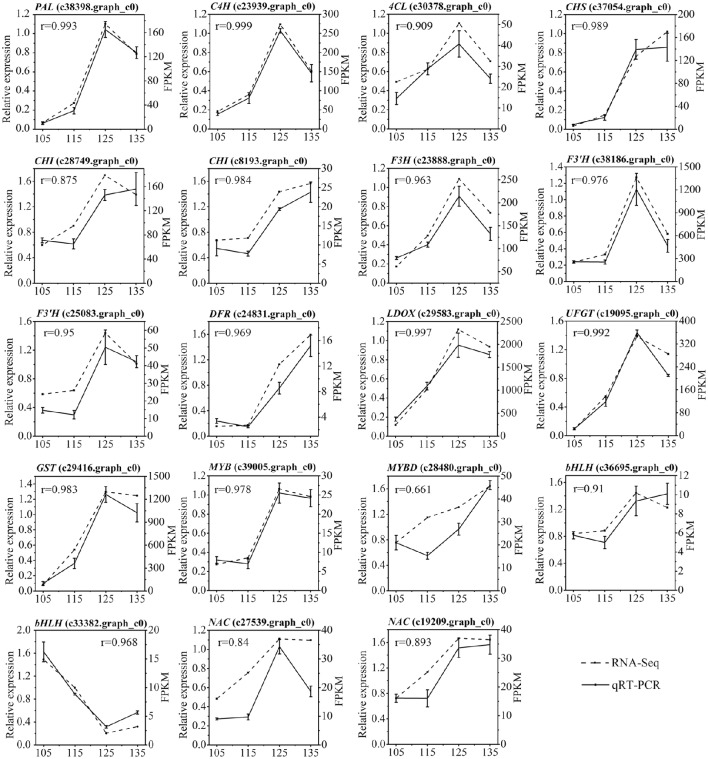
Figure 9.
Expression analysis of 19 differentially expressed genes related to anthocyanin biosynthesis in ‘Furongli’ plums during fruit ripening. Actin was used as the internal control. The error bars represent the standard error of three biological replicates. The numbers above the graphics correspond to values obtained with the Pearson correlation. Pearson correlation between the RNA-seq data and qRT-PCR data was calculated using the log2 value of FPKM and the relative expression level.

