Fig. 3.
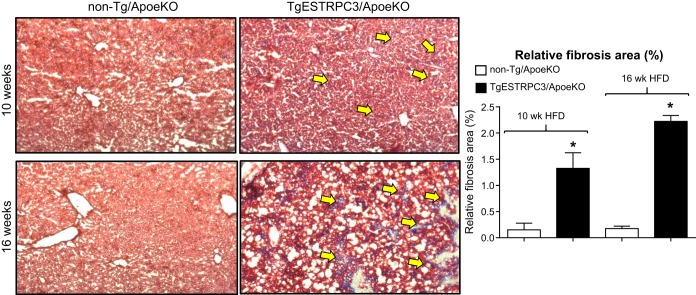
TgESTRPC3/ApoeKO or their nontransgenic littermates (non-Tg/ApoeKO) were maintained on a high-fat diet for 10 (top panels) or 16 (bottom panels) wk. At the end of the diet periods mice were killed and liver sections (10 μm) prepared and stained with Mason's trichrome to evaluate collagen content. Fibrotic areas (blue staining) are indicated by arrows. The bar graph shows relative fibrosis area (% of total liver area) as means ± SE, n = 8. *P < 0.001 vs. controls.

