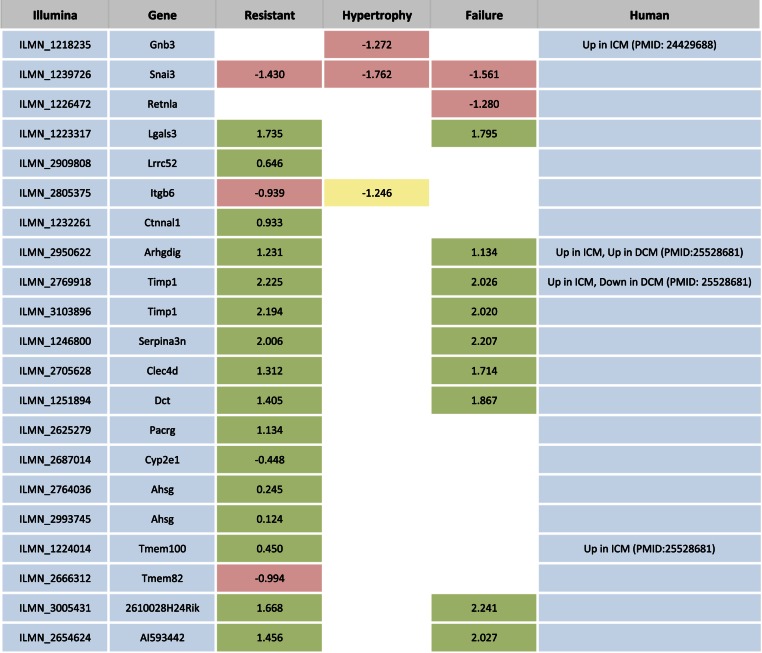
Fig. 2.
Genes with shared expression response within phenotype groups. We identified genes that showed the same expression response to isoproterenol in at least 75% of strains within any 1 phenotype group and cross-referenced the genes with patient heart failure expression data. Colored boxes represent genes were at least 75% of strains within a phenotype group showed a consistent gene expression response (green is upregulated, ISO-basal >1; red is downregulated, ISO-basal <1; yellow is no change, ISO-basal between −1 and 1). White boxes represent genes where, for that phenotype, there was not a consistent response. The value represents the mean ISO-basal value. Note that the mean is not always representative of the majority of strains due to outliers; the trend of the majority is indicated by the color. ICM, ischemic cardiomyopathy; DCM, dilated cardiomyopathy.

