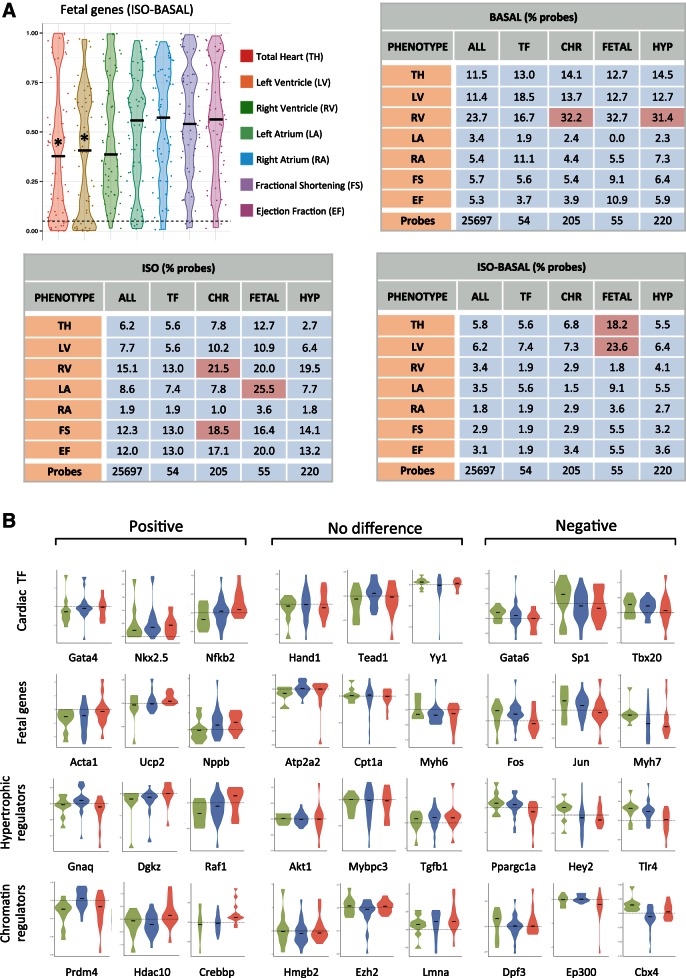
Fig. 3.
Gene groups, but not individual fetal genes, correlate with cardiac hypertrophy across diverse genetic backgrounds. A: mRNA abundance for individual probes on the microarray were compared with cardiac parameters across all 84 strains and plotted to identify genes whose expression, or change in expression, was significantly correlated with a trait in either basal or isoproterenol-treated hearts (Pearson correlation, P < 0.05). Plotted is the distribution of P values for individual probes. Tables show the percentage of probes within a subset of genes that demonstrate significance. Gene subsets that were enriched for probes that were correlated with phenotype were determined by normalizing to the level of correlation across all probes on the microarray. * or red indicates P < 0.05 for enrichment of gene subset with respect to the entire array. B: the changes in expression after isoproterenol for individual cardiac transcription factors (TF) (n = 31), fetal genes (n = 37), hypertrophic regulators (n = 142), and chromatin regulators (n = 124) reveal no significant difference between resistant, hypertrophic, or failing mice. Shown are examples of genes with nonsignificant positive and negative trends across these groups. Red indicates failing, green resistant, and blue hypertrophic strains. Horizontal lines represent change of 0.

