Fig. 4.
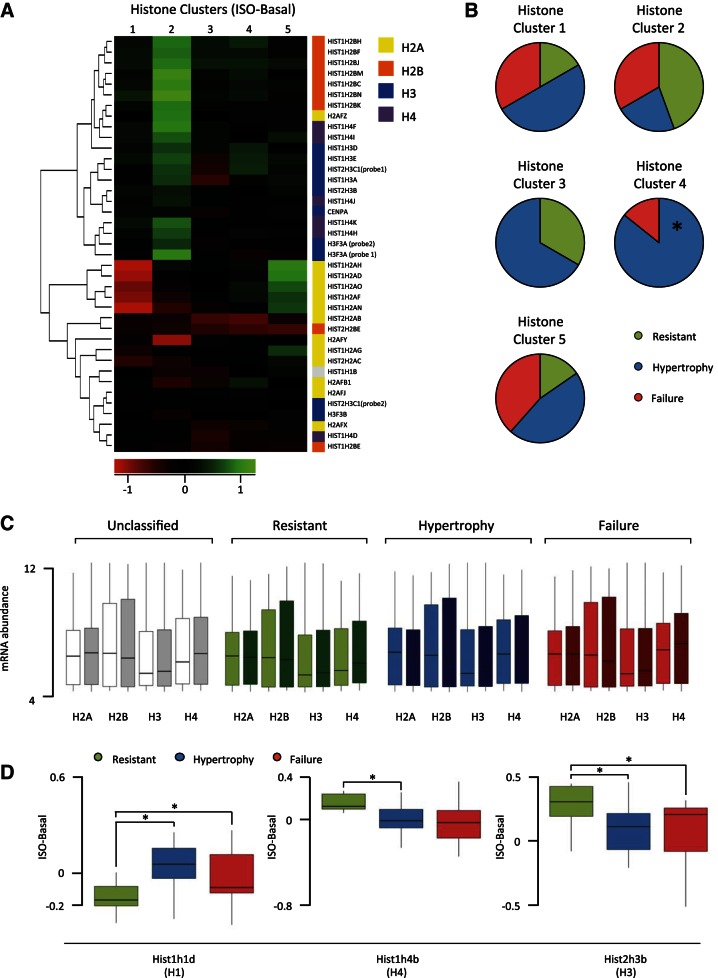
Clustering mice by histone expression reveals patterns of change associated with phenotype. A: hierarchical ordered partitioning and collapsing hybrid (HOPACH) clustered strains into 5 groups based on histone expression change with isoproterenol. Rows indicate individual histone variants, while shading represents changes in expression; n = 12, cluster 1; n = 9, cluster 2; n = 3, cluster 3; n = 7, cluster 4; n = 13, cluster 5. B: for each histone cluster, the composition of phenotype group is shown. Cluster 4 is significantly enriched (enriched 2.57-fold, P = 0.0068) for hypertrophic mice and depleted for resistant mice (P = 0.0585, not significant). C: abundance of all variants for each of the core histones was pooled across strains in the basal (light) or isoproterenol-treated (dark) hearts, revealing no gross differences between phenotypic groups. D: 3 histone variants were differentially regulated by isoproterenol between phenotype groups (*P < 0.05).

