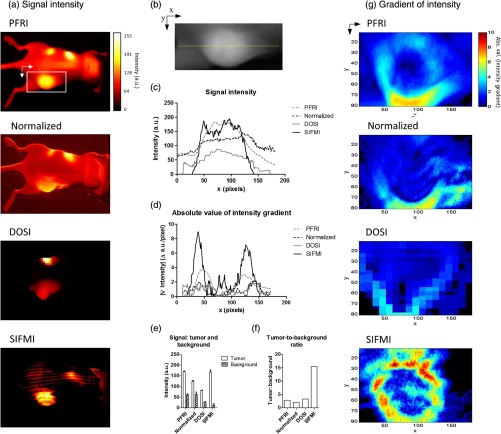
Fig. 3.
(a) Fluorescence signal intensity (normalized to 8-bit for visual contrast) for the same mouse imaged using planar imaging, fluorescence/reflectance imaging, diffuse imaging, and structured illumination. (b) Example of ROI analyzed, with yellow line indicating the origin for the values plotted in (c) and (d). (c) Signal intensity plot for each image along yellow line in (b). (d) Absolute value of the gradient of intensity plotted along the line selected. (e) Signal intensity quantified for the tumor region and the nontumor region. (f) Tumor-to-background ratio calculated using the signal intensity. (g) Absolute value of the gradient of intensity visualized over the ROI for the different imaging methods.

