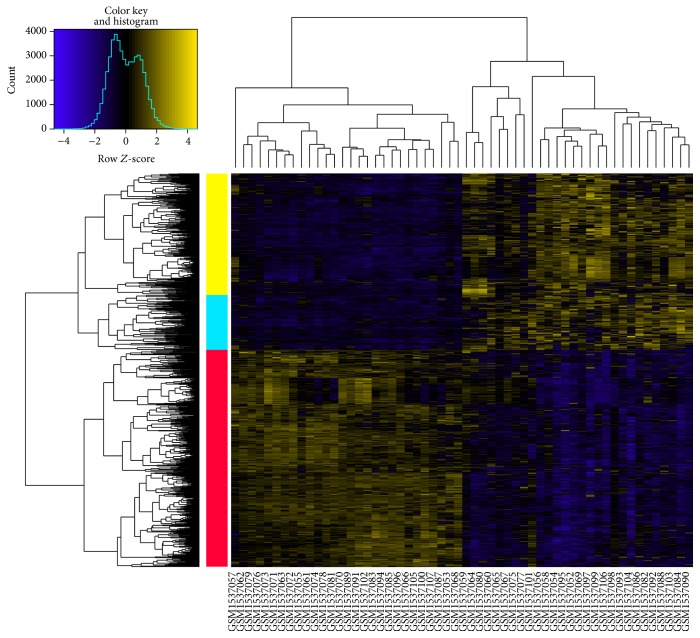
Figure 1.
The heat map of the DEGs. Yellow and blue bars represent upregulated and downregulated genes, respectively. Two-way clustering results in the left side indicate that DEGs were clustered into three categories. Yellow and blue columns represent upregulated genes in lung adenocarcinoma tissues, while red column stands for downregulated genes.

