Figure 5.

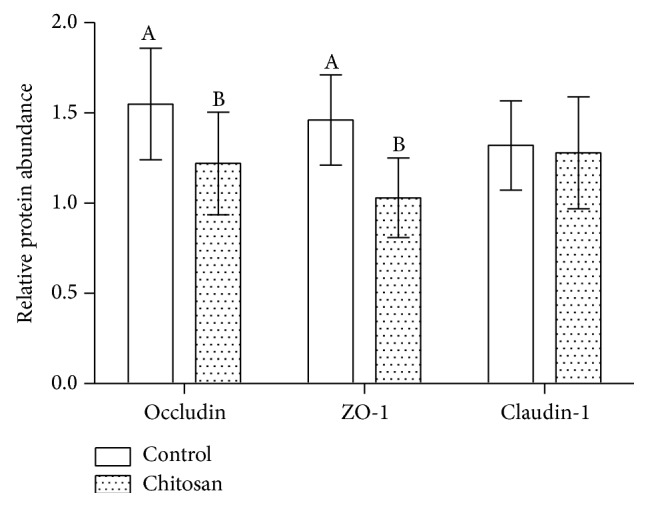
The relative abundance of tight junction proteins in the control and COS groups. A and B: different letters indicate a statistical difference between the control and COS groups.

The relative abundance of tight junction proteins in the control and COS groups. A and B: different letters indicate a statistical difference between the control and COS groups.