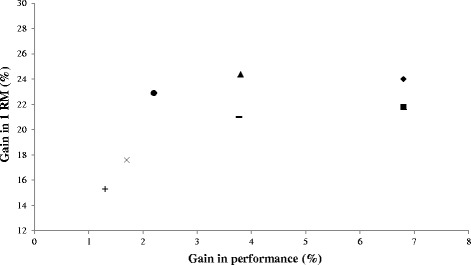
Figure 1.

The gains in strength and d ifferent motor abilities of high-level players after 5 to 10 weeks. Squares represent the average squat jump performance [1,6,14,22]; rhombi represent the average countermovement jump performance [2,22,37]; triangles represent the average four bounce test performance [6]; circles represent the average 10-m sprint performance [2,22,37,38]; x symbols represent the average 40-m sprint performance [1,2,6]; + symbols represent the average change in direction ability [2,38]; and lines represent the average of all the previous motor tasks.
