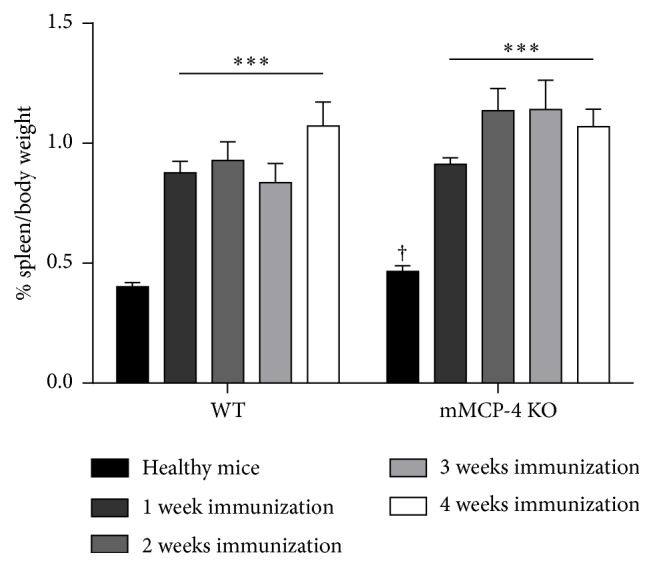
Figure 2.

Induction with MOG/CFA induced an increase of spleen weight compared to healthy mice. Each bar represents the mean ± SEM of 6 to 15 mice. ∗∗∗ p < 0.001 versus healthy WT or healthy mMCP-4 KO mice or † p < 0.05 comparing WT versus KO mice at each time point studied.
