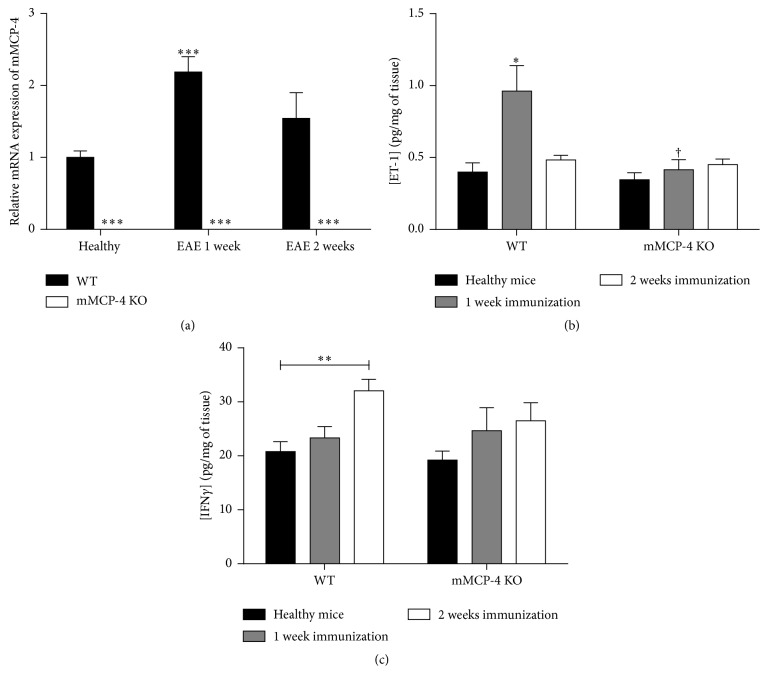
Figure 7.
mMCP-4 brain mRNA expression is increased 1 week after EAE and is correlated with increase of ET-1 brain levels whereas INFγ is enhanced 2 weeks after EAE in spinal cord of WT but not mMCP-4 KO mice. (a) mRNA relative expression of mMCP-4 in healthy or 1 or 2 weeks after EAE quantified in WT (closed bars) and in mMCP-4 KO (opened bars) mice. (b) ET-1 levels of healthy (closed bars), 1 week (grey shaded bars), or 2 weeks after EAE (opened bars) in WT and mMCP-4 KO mice. (c) INFγ levels of healthy (closed bars), 1 week (grey shaded bars), or 2 weeks after EAE (opened bars) in WT and mMCP-4 KO mice. Each bar represents the mean ± SEM of 4 to 8 mice. ∗ p < 0.05; ∗∗ p < 0.01; ∗∗∗ p < 0.001 compared to WT mice or † p < 0.05 comparing WT versus KO mice at each time point studied.

