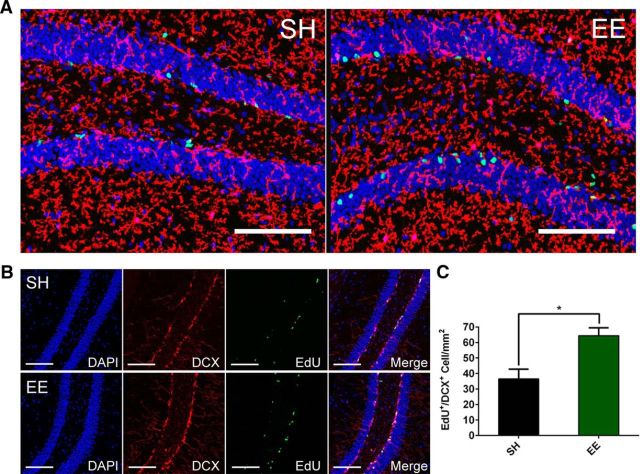
Figure 2.
EdU labeling during EE shows minimal microglial division while significantly more neurogenesis by EE. A, Representative images showing minimal EdU (green)/P2ry12 (red) colocalization (blue, DAPI). Scale bar, 100 μm. B, Representative images showing majority of EdU (green) signals colocalize with DCX (red), a marker for newborn neurons. Scale bar, 100 μm. C, Quantification of EdU+/DCX+ cell counts (no. of cells/mm2) in the dentate gyrus of EE and SH mice indicates significantly higher level of neurogenesis in EE mice. *p < 0.02. N = 6. Data are mean ± SEM.

