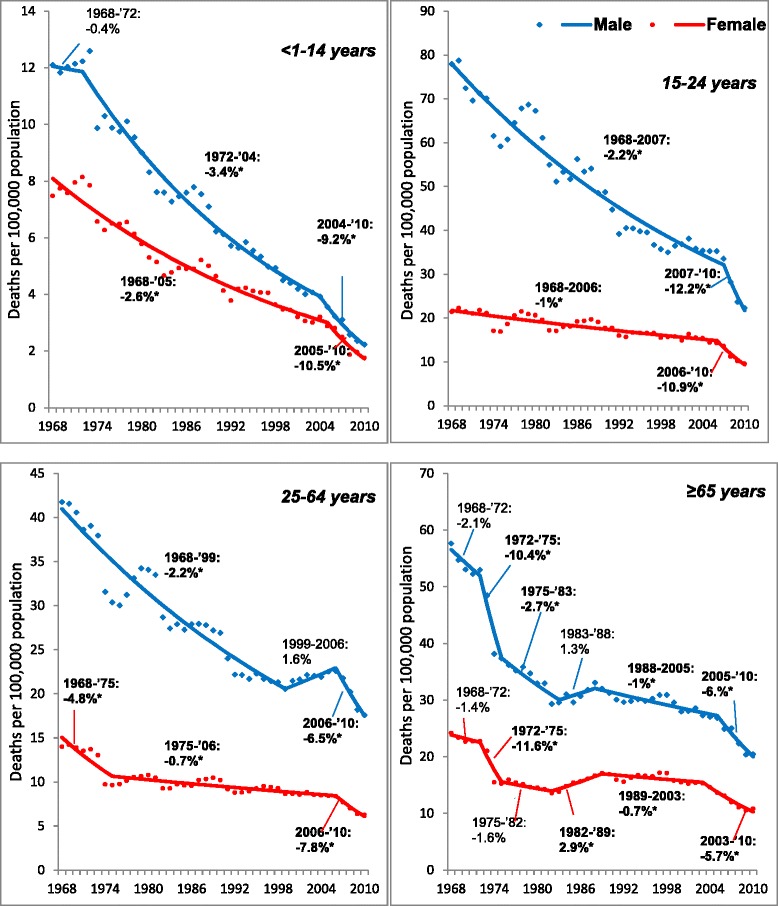
Figure 3.

Joinpoint analysis of motor vehicle traffic fatality trends, by age groups and sex, 1968 to 2010. The Y-axis scale varies across age group figure panels. Percentages depicted in figure s are Annual Percent Changes (APCs) from Joinpoint analyses of age-standardized MV fatalities trends Models are based on random errors corrected for autocorrelation estimated from the data by the Joinpoint Program. *APC is two tailed significant at p<0.05; MV- Motor vehicle.
