Figure 3.

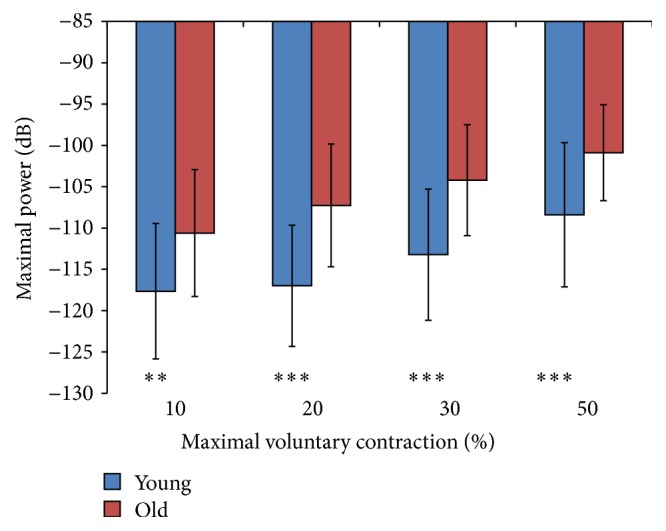
Maximal power (dB) of the EMG signal PSD as a function of force (% MVC) in young and old cohorts. Significant age-associated difference indicated by ∗∗ p < 0.05; ∗∗∗ p < 0.01.

Maximal power (dB) of the EMG signal PSD as a function of force (% MVC) in young and old cohorts. Significant age-associated difference indicated by ∗∗ p < 0.05; ∗∗∗ p < 0.01.