Fig. 3.

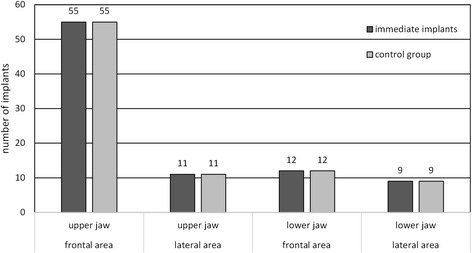
Number of implants in the respective region (anterior region ranging from 13 to 23 and 33 to 43, and posterior region ranging from 18 to 14, 24 to 28, 38 to 34, and 44 to 48)

Number of implants in the respective region (anterior region ranging from 13 to 23 and 33 to 43, and posterior region ranging from 18 to 14, 24 to 28, 38 to 34, and 44 to 48)