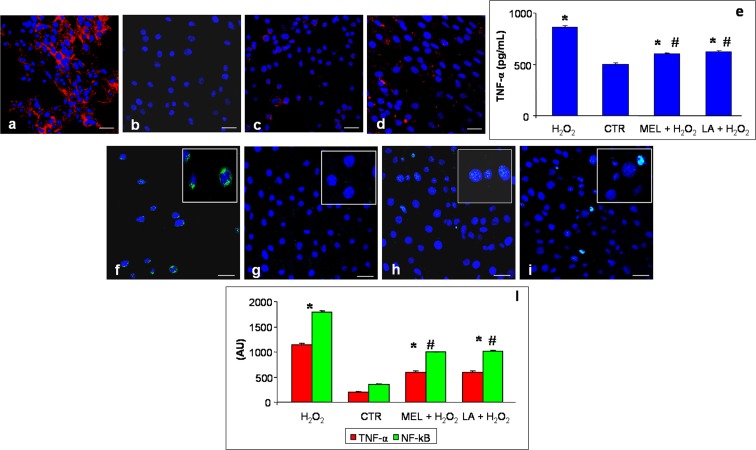
Fig. 2.
Immunofluorescence analyses of tumour necrosis factor-α—TNF-α (a–d) and nuclear factor kappa-B—NF-kB (f–i) in L6 myotubes incubated with hydrogen peroxide—H2O2 (a, f), control—CTR (b, g), pre-treated with melatonin and then incubated in hydrogen peroxide—MEL + H2O2 (c, h) and pre-treated with LA and then incubated in hydrogen peroxide—LA+ H2O2 (d, i). The insets show the NF-kB-positive nuclei of each experimental group. Scale bar = 20 μm. The graph (e) represents the quantitative measure of TNF-α in cell lysates (pg/mL) and summarizes the quantitative analysis of immunopositivities of both TNF-α and NF-kB (i). * p < 0.05 vs control cells and #p < 0.05 vs hydrogen peroxide-treated cells

