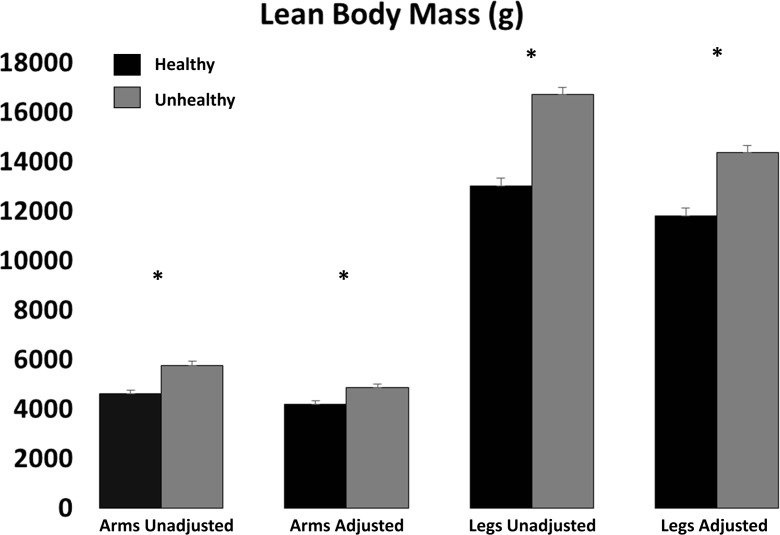
Fig. 2.
Lean body mass in healthy weight and obese (unhealthy) individuals. Values represent mean (standard error) for lean body mass. Asterisk denotes significant (P < 0.05) differences between healthy (black bar) and unhealthy (grey bar) individuals before and after adjusting for fat-free adipose tissue

