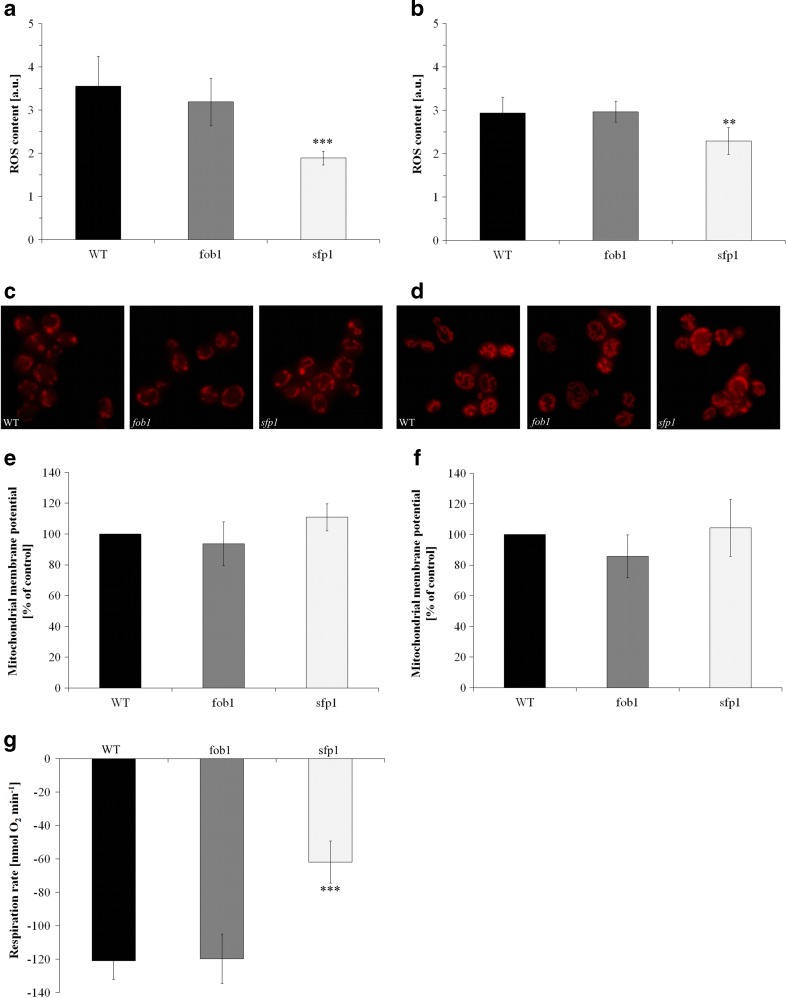
Fig. 9.
Superoxide anion (one type of ROS) content was estimated with the fluorescent probe dihydroethidine for yeast cells grown on liquid medium with glucose (a) or with glycerol (b). Data are presented as mean ± SD from at least three independent experiments. Bars indicate SD; **P < 0.01 and ***P < 0.001 of significantly different values with respect to the wild-type strain estimated with ANOVA and Dunnet post-hoc test. The mitochondrial network was stained with rhodamine B hexyl ester—a red fluorescent stain. The photos present the typical result of the duplicate experiment for yeast cells grown on medium with glucose (c) or glycerol (d). The mitochondrial membrane potential was assessed with rhodamine 123 for yeast cells grown on medium with glucose (e) or glycerol (f). Data come from at least three independent experiments and are presented as per cent of control (wild-type strain). Bars indicate SD; **P < 0.01 and ***P < 0.001 of significantly different values with respect to the wild-type strain estimated with ANOVA and Dunnet post-hoc test. The oxygen consumption was followed by oxygen electrode (Oxytherm, Hansatech, UK) for 5 min at 28 °C for yeast cells grown on medium with glycerol (g). Data are expressed as respiration rate [nmol O2 min−1] and presented as mean ± SD from three independent experiments. Bars indicate SD; **P < 0.01 and ***P < 0.001 of significantly different values with respect to the wild-type strain estimated with ANOVA and Dunnet post-hoc test

