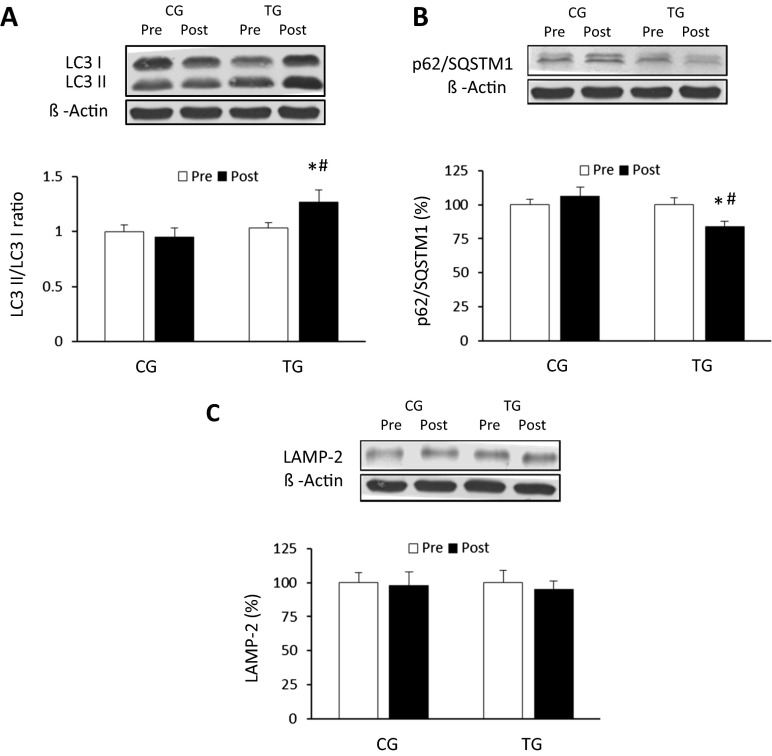
Fig. 2.
Densitometric quantification and representative Western blot of LC3II, LC3I (a), p62/SQSTM1 (b), and LAMP-2 (c) in PBMCs in response to 8 weeks of aerobic training for TG and the same period of normal daily routines for CG. Values are means ± SEM.*p < 0.05 vs CG; #p < 0.05 vs Pre within a group

