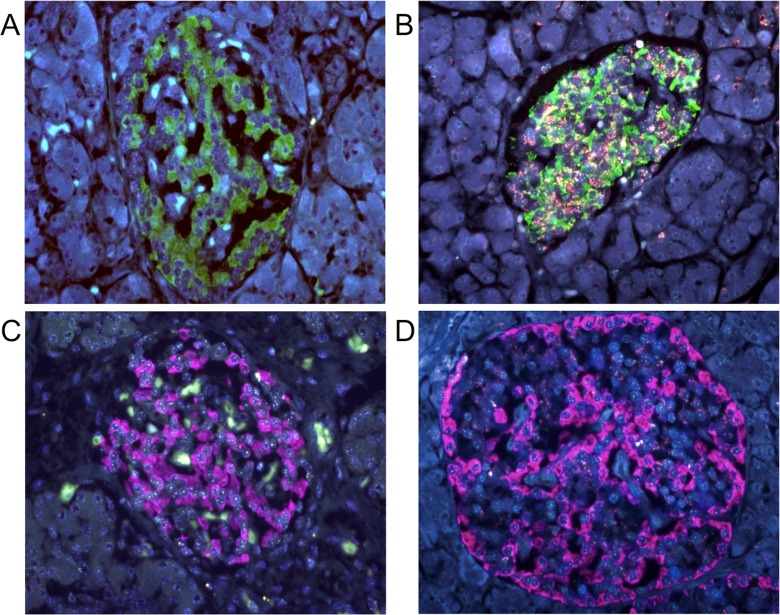
Fig. 1.
Representative FISH images showing immunofluorescence for insulin (a, b) and glucagon (c, d) in specimens from young (a, c) and old (b, d) subjects. Original magnification, ×40. In all slides, nuclear red, green, and blue signals are those for telomere-Cy3, centromere-FITC, and DAPI counterstaining for DNA, respectively. a, b Cytoplasmic green indicates the insulin-Cy-5 signal. a Image of a specimen from a 4-month-old infant. The NTCR for insulin-positive cells was 3.28. The reddish ivory color is not the telomere signal but non-specific fluorescence from the cytoplasm of islet cells. Red telomere and green centromere signals are always observed within the nuclei. b Images of a specimen from a 72-year-old woman. The NTCR for insulin-positive cells was 0.89. c, d Cytoplasmic pink indicates the glucagon-Cy-5 signal. c Image of a specimen from a 0-day-old neonate. The NTCR for glucagon-positive cells was 2.85 in this sample. d Image of a specimen from an 84-year-old woman. The NTCR for glucagon-positive cells was 0.88 in this sample

