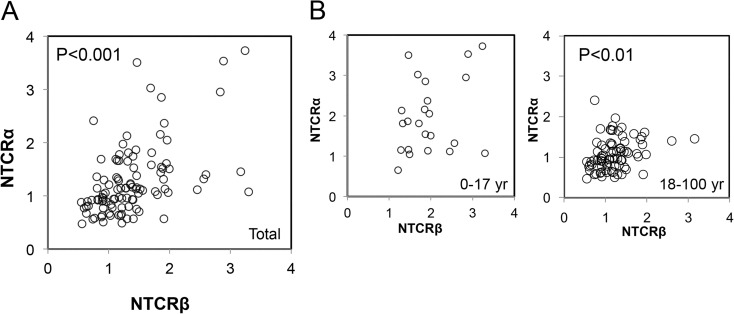
Fig. 3.
Correlation between NTCRβ and NTCRα. (p < 0.001). a Plots for the subjects as a whole. NTCRβ and NTCRα were positively correlated with each other (p < 0.001). b Plots for the subjects divided into two age categories, under 18 and 18 years and over. A significant positive correlation was found only for the adult group (p = 0.01)

