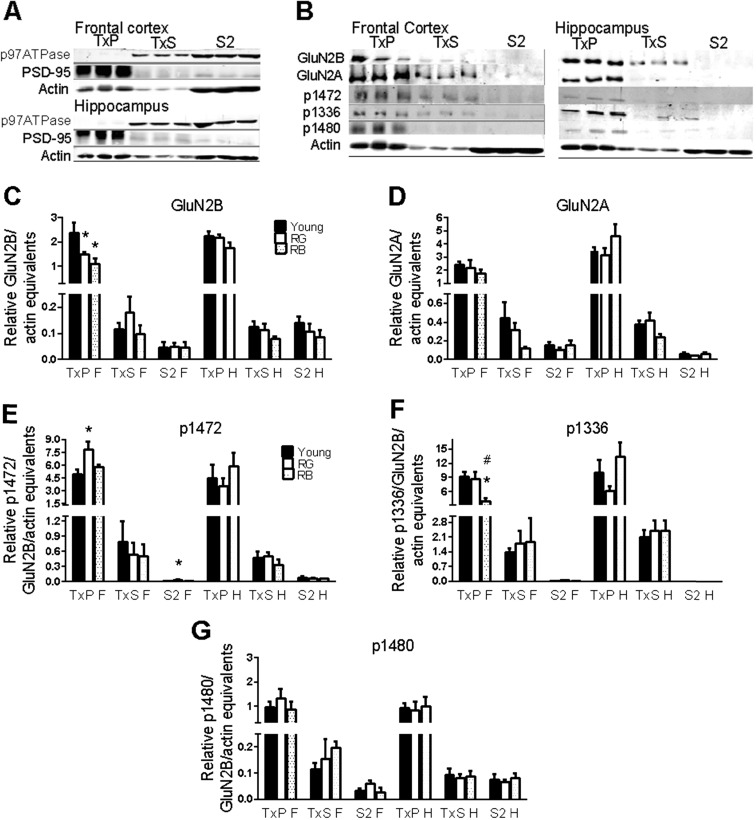
Fig. 2.
GluN2 subunits. a–b Representative blots for proof of fractionation from Triton X-100 membrane solubilization (a) and GluN2 proteins (b). Order of lanes within each fraction from left to right is young, RG, and RB. c–g Significant differences in reference memory status were seen for GluN2B (c), p1472 (e), and p1336 (f), but not for GluN2A (d) or p1480 (g). Asterisk indicates p < .05 for difference from young. Number sign indicates p < .05 for difference from RG (ANOVA and Fisher’s PLSD). Data = mean ± SEM. RG = old Reference memory-Good. RB = old Reference memory-Bad. TxP = Triton-insoluble pellet, synaptic membranes. TxS = Triton-soluble membranes, extrasynaptic membranes. S2 = cytosolic membranes. F = frontal cortex. H = hippocampus. N = 3–11. Sample sizes for each group with significant differences was Young (N = 11), RG (7), and RB (5), with the following exceptions: p1472-F(S2): Y(10), RG (6). p1336-F(TxP): RB(4)

