Figure 12.
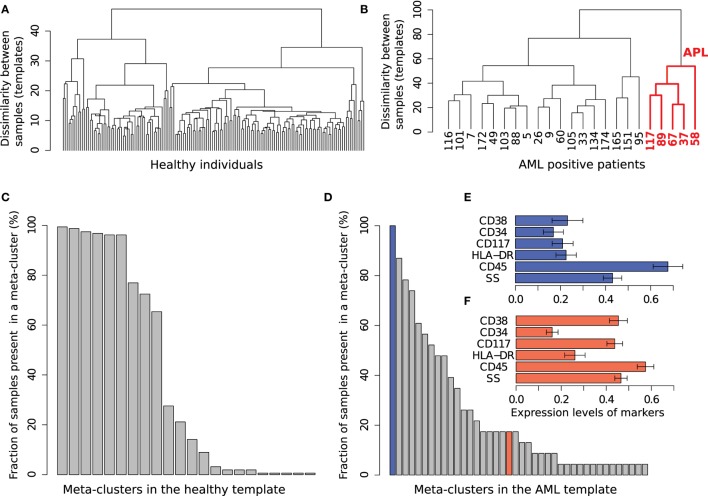
The healthy and AML templates created from Tube 6. (A) The template tree created from 156 healthy samples in the training set. (B) The template tree created from 23 AML samples in the training set. Samples in the red subtree exhibit the characteristics of acute promyelocytic leukemia (APL) as shown in (F). (C) Fraction of 156 healthy samples present in each of the 22 meta-clusters in the healthy template. Nine meta-clusters, each of them shared by at least 60% of the healthy samples, form the core of the healthy template. (D) Fraction of 23 AML samples present in each of the 40 meta-clusters in the AML template. The AML samples, unlike the healthy ones, are heterogeneously distributed over the meta-clusters. (E) The expression levels of markers in the meta-cluster shown with blue bar in (D). [Each horizontal bar in (E,F) represents the average expression of a marker and the error bar shows its SD]. This meta-cluster represents lymphocytes denoted by medium SS and high CD45 expression and therefore does not express the AML-related markers measured in Tube 6. (F) Expression of markers in a meta-cluster shown with red bar in (D). This meta-cluster denotes myeloblast cells as defined by the SS and CD45 levels. This meta-cluster expresses HLA-DR−CD117+CD34−CD38+, a characteristic immunophenotype of APL. Five AML samples sharing this meta-cluster are similar to each other as shown in the red subtree in (B).

