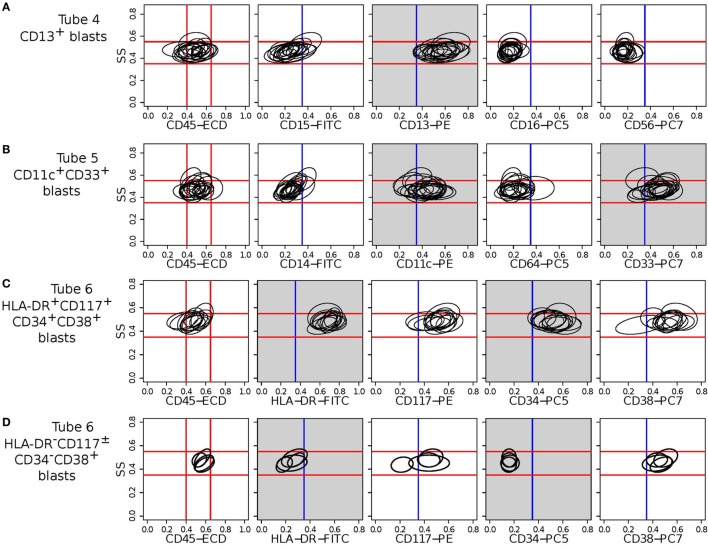
Figure 13.
Bivariate contour plots (side scatter vs. individual marker) for two meta-clusters (one in each row) indicative of AML. The ellipses in a subplot denote the 95th quantile contour lines of cell populations included in the corresponding meta-cluster. Myeloblast cells have medium side scatter (SS) and CD45 expressions. The red lines indicate approximate myeloblast boundaries (located on the left-most subfigures in each row and extended horizontally to the subfigures on the right) and confirm that these meta-clusters represent immunophenotypes of myeloblast cells. Blue vertical lines denote the ± boundaries of a marker. Gray subplots show contour plots of dominant markers defining the meta-cluster in a row. (A) CD13+CD56– meta-cluster shared by 17 AML samples in Tube 4. (B) CD4–CD11c+CD64–CD33+ meta-cluster shared by 18 AML samples in Tube 5. (C) HLA-DR+CD117+CD34+CD38+ meta-cluster shared by 11 AML samples in Tube 6. (D) HLA-DR–CD117±CD34–CD38+ meta-cluster shared by 5 AML samples in Tube 6. The last meta-cluster is indicative of acute promyelocytic leukemia (APL).

