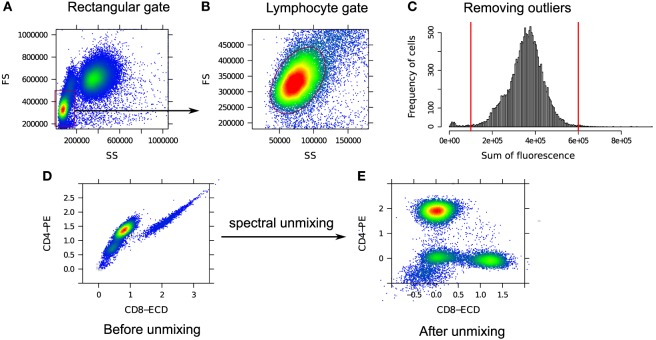
Figure 5.
(A) A predefined rectangular gate (red rectangle on the lower left corner) denotes an approximate boundary for the lymphocytes. (B) Inside the rectangular gate, lymphocytes are identified as a dense and normally distributed region (red ellipse). (C) Outlying cells fall outside of a pair of predefined thresholds shown with the red vertical lines and are removed. (D) Correlated CD4 and CD8 expressions due to the spectral overlap between PE and ECD fluorochromes. (E) CD8 vs. CD4 expressions after spectral unmixing. The inverse hyperbolic sine (asinh) transformation is used in (D,E) for visualization.

