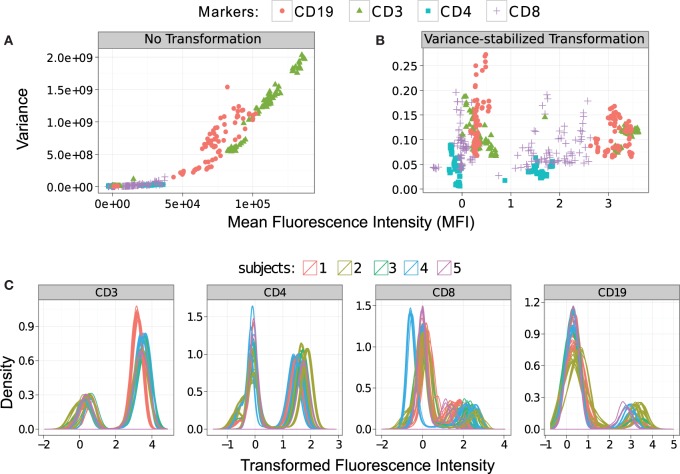
Figure 6.
Stabilizing the within-cluster variance for each channel of the HD dataset. (A) Variances of the clusters increase monotonously with their means before the variances are stabilized. Clusters in each marker are shown with the same symbol and color. (B) Variances are approximately stabilized for each marker/channel after the data are transformed by the asinh function with the optimum cofactor. (C) Density of the variance-stabilized fluorescence channels are plotted where different subjects are denoted with different colors.

