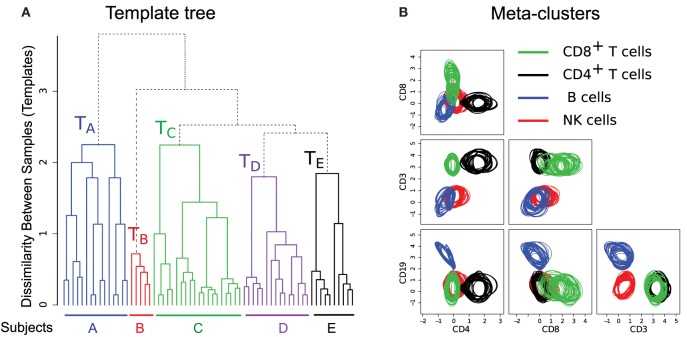
Figure 8.
(A) The template tree created by HM&M algorithm from all samples of the HD dataset. Leaves of the dendrogram denote samples from five healthy individuals. An internal node represents a template, and the height of an internal node measures the dissimilarity between its left and right children. The sample-specific subtrees are drawn in different colors. (B) Bivariate projections of the combined template [the root of the tree in (A)] are drawn in terms of its meta-clusters. Here, each meta-cluster is represented by a homogeneous collection of cell clusters that are drawn with the 95th quantile contour lines. Clusters participating in a meta-cluster are drawn in same color.

