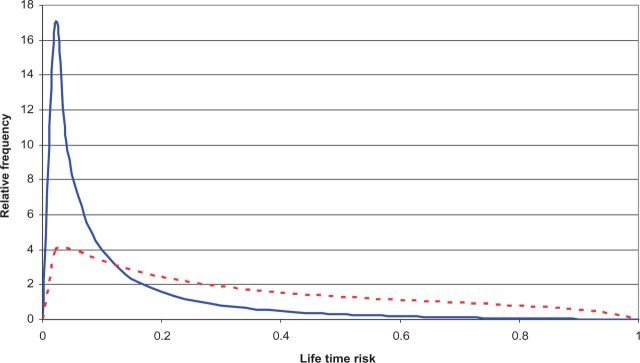
Figure 1.
Comparison of the theoretical distribution of familial risk profile (FRP) for women from the general population (blue line) and for those affected with either early-onset breast cancer or unaffected but with a strong family history of breast cancer, equivalent to a 3-fold increased risk (dotted red line), under a multiplicative, multifactorial, polygenic model. For details see 18,47 .

